
The S&P 500 return of 15% for the second quarter is the best 2Q return in a midterm election year since the index had a 36% return in 1936! It was the 12th best overall quarter since 1950. Who would have believed that there would be such a positive return during a war with Iran, the closing of the Strait of Hormuz, and oil prices reaching above $100? But here we are. Why? Because earnings are powering this stock market higher with the strong capital spend on AI that is fueling a major industrial build-out as we shift to an economy using AI.
S&P 500 Earnings Growth Holding Strong As We Enter 3Q
S&P 500 1Q year-over-year earnings growth rate was 28%, surpassing all estimates. As we enter 2Q earnings season, FactSet is reporting that analysts and companies have been more optimistic than normal in their earnings outlooks for the quarter. As a result, estimated earnings for the S&P 500 for 2Q are higher today compared to expectations at the start of the quarter. Importantly, earnings growth is expected to be above 20% for the second-straight quarter.
Labor Market Signals Are Softer Than Many Realize. Implications for the Fed
Two government surveys point to a cooling in the job market. The Household Survey (which measures civilian employment, including self- employed and small-business roles, by asking people directly about their work) has shown year-over-year declines, falling from roughly 170.5 million in January 2026 to about 169.4 million by June. This lines up with the key Nonfarm Payrolls (NFP) employment report for June, released last week, announcing the addition of 57,000 jobs, well below expectations. Leisure and hospitality, a major consumer-facing sector, lost 61,000 jobs due to weaker seasonal hiring. There were also negative revisions to May’s data supporting the weaker data for June. But the unemployment rate did fall to 4.2% from 4.3%, because there are workers leaving the workforce.
For investors, this softer labor picture relieves pressure on Federal Reserve (Fed) Chair Kevin Warsh and the broader Federal Open Market Committee (FOMC) to raise rates, a view counter to much of the recent market consensus.
Defense Stocks: A Theme Rocketing
Defense (military) stocks represent a multi-year opportunity backed by real-world needs. Higher U.S. and allied defense spending is being driven by the need to (1) replenish munitions supplied to Ukraine, (2) respond to recent actions involving Iran, and (3) prepare for potential contingencies around Taiwan. Budgets are already topping $1.0 trillion annually, with proposals for even larger increases ahead.
Innovation adds another layer: the shift toward cheaper, AI-enabled, and autonomous systems (exemplified by high-profile private companies like Anduril) allows for scalable production that traditional expensive platforms cannot match. The Defense Stocks theme has legs as competition among global powers persists, offering potential earnings growth and a measure of resilience in uncertain times – though headline-driven volatility means the theme works best as a diversified allocation.
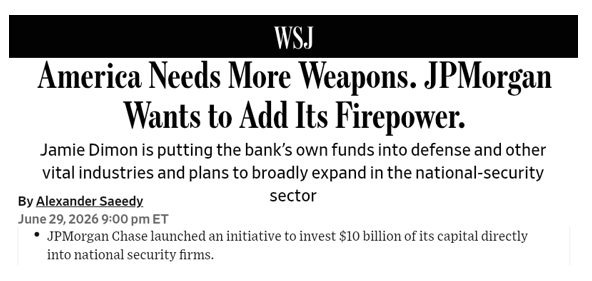
Defense Orders Are Rising At A Sharp Pace
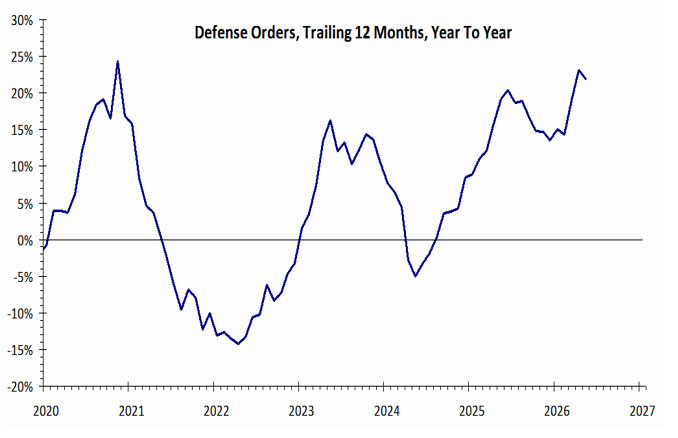
iShares U.S. Aerospace & Defense ETF (ITA)
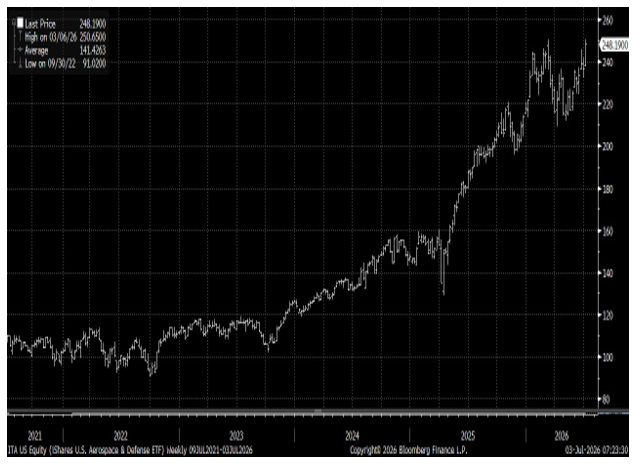
Oil and Energy Relief as Tensions Ease
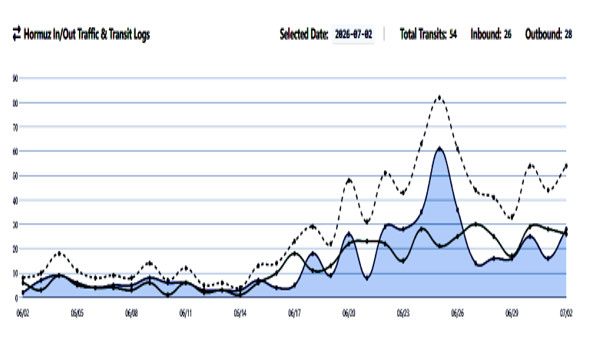
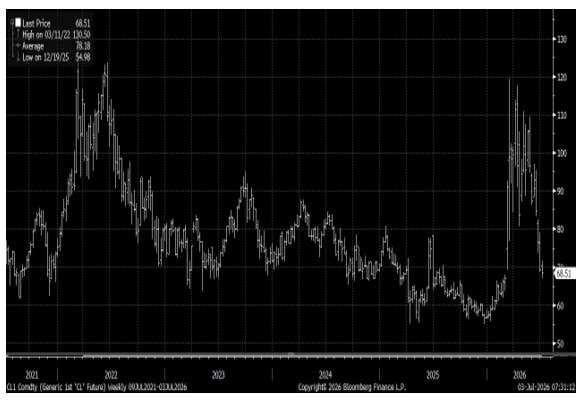
Oil prices fell sharply this week as news of a de-escalation between the U.S. and Iran reduced immediate supply fears. Renewed commercial traffic through the Strait of Hormuz (a critical chokepoint for global oil shipments; see accompanying chart) helped ease the geopolitical risk premium. Lower crude pricing benefits consumers through cheaper gasoline, supports broader equities by reducing inflation worries, and provides a notable tailwind to transportation stocks. Airlines, for example, rose on expectations of lower jet fuel costs, a key operating expense that can meaningfully boost margins in a competitive industry. This dynamic also aids trucking, shipping, and other industrials, reinforcing the sector rotation currently underway. Conversely, Energy stocks themselves faced pressure from the price drop, highlighting the sector’s sensitivity in a rotational market. But Energy company earnings forecasts are very strong, so we view corrections as a buying opportunity.
Traffic Through The Strait Of Hormuz Is Rising
WTI Crude Oil Prices Down Sharply
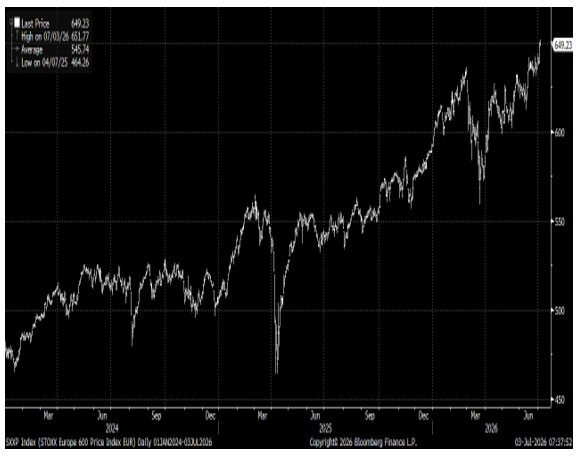
STOXX Europe 600 Breaks To New Record Highs
We continue to believe that international markets entered a new secular bull market last year. The STOXX Europe 600 moved to an all-time high last week and was up 8.0% for the first half of the year. We continue to recommend diversifying portfolios into non-U.S. equity markets.
STOXX Europe 600 Breaks To New Record Highs
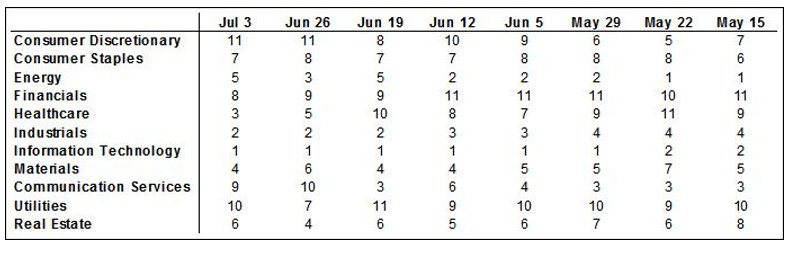
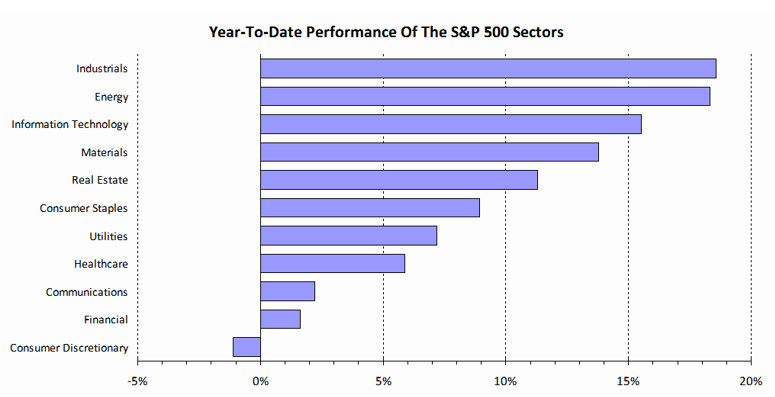
Sector Readings: Information Technology In First Place, Followed By Industrials, Then Healthcare; Consumer Discretionary In Last Place, Followed By Utilities
Information Technology remains the strongest, followed by Industrials, then Healthcare. Consumer Discretionary is in last place, followed by Utilities.
Our sector model analyzes S&P 500 GICS sector classifications, using a weighted measure of price momentum across three time periods. We rank each sector from best to worst based upon the average of its 40-, 26-, and 13-week relative price performances. We rank each sector from 1 to 11, with 1 being the strongest and 11 the weakest.
Sector Rankings By 40-, 26-, And 13-Week Average Relative Price Performance
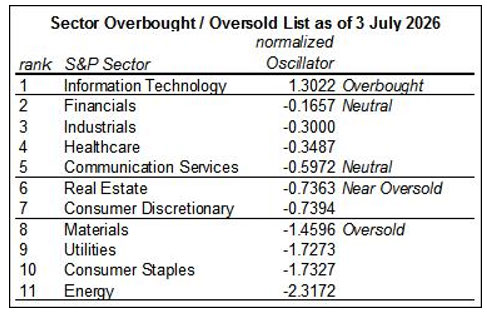
OBOS List: Information Technology Remains Overbought; Energy, Consumer Staples, Utilities, And Materials Are Oversold; Consumer Discretionary And Real Estate Are Near Oversold.
Information Technology was still overbought last week. Energy is still significantly oversold; Consumer Staples, Utilities, and Materials are all also oversold; Consumer Discretionary and Real Estate were near oversold. The extreme overbought/oversold situation we saw three weeks ago is only partially alleviated. Conditions for continued sector rotation persist, and such rotations often involve higher volatility.
Our tactical sector rotation model uses the S&P 500 GICS sector classifications. We apply a 13-week rate of change methodology that normalizes the rankings from overbought (OB) to oversold (OS). An industry group is overbought when it has risen too far too fast, relative to the rest of the market, based upon its normal movement. Conversely, it’s oversold when it has lost too much too fast, relative to the rest of the market, based upon its normal movement. Over time, a sector tends to move back toward its normal rate of change, relative to the rest of the market. Overbought sectors tend to slow their pace of gains in relative price, while oversold sectors tend to improve in relative price until they reach their average performance again.
Here’s our methodology: the overbought-oversold table of sectors measures the 13-week rate of change in the relative price of each sector. We then average (i.e., smooth) this over 3 weeks and normalize the results. Normalized oscillator values over 1.0 are considered overbought, while those between 0.6 and 1.0 are considered near overbought. Normalized oscillator values below -1.0 are considered oversold, while those between -0.6 and -1.0 are considered near oversold.
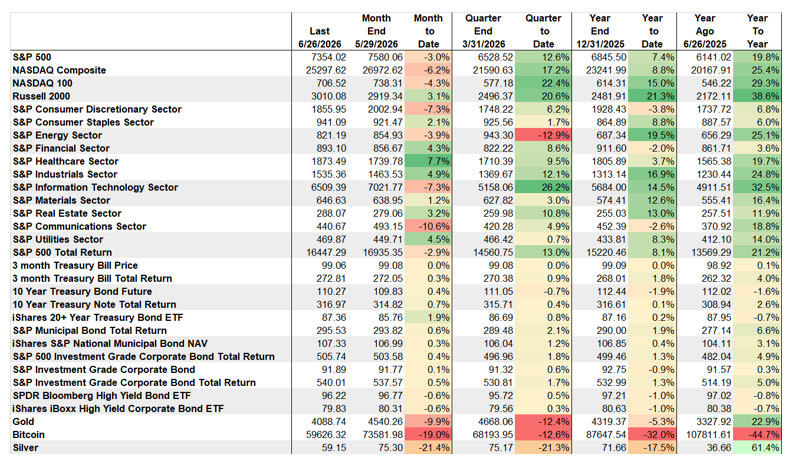
Market Performance: Russell 2000 Was The Best Performing Asset Year-To-Date, Followed By Energy And Industrials; Bitcoin Is Still Weakest
This Week Markets Return to a Full Schedule
Following the holiday break, markets return to a full schedule, though this relatively light week could still influence sentiment ahead of heavier July releases. Today brings the Institute for Supply Management (ISM) Services Purchasing Managers Index (PMI) and S&P Global Services PMI, offering a read on the economy’s largest sector. On Wednesday, investors will parse the June FOMC Minutes for insight into how Fed Chair Kevin Warsh is approaching his new role, particularly after recent weak labor data. PepsiCo (PEP) and Delta Air Lines (DAL) are among the notable companies reporting this week, before earnings season begins in earnest next week with major banks starting on Tuesday, July 14.
The Week's Calendar
MON
9:45 AMUS Services PMI
10:00 AMISM Report On Business Services PMI
11:00 AMGlobal Services PMI
TUE
No events scheduled
WED
10:00 AMMonthly Wholesale Trade
2:00 PMFederal Open Market Committee meeting minutes and economic forecast
3:00 PMConsumer Credit
8:00 PMBank of England Deputy Governor Sarah Breeden, FRB New York President John Williams and FRB
Dallas President Lorie Logan speak at The Future of Market Liquidity and Functioning Workshop
THU
8:30 AMWeekly Jobless Claims
10:00 AMExisting Home Sales
EARNINGSPepsiCo*
FRI
No events scheduled
EARNINGSDelta Air Lines
* Earnings reflect highlights Sources: MarketWatch/Kiplinger's
