

Artificial intelligence (AI) may be an important contributor to these stronger productivity gains. Corporate earnings have been superb, driven by actual revenue growth. Margin debt (i.e., borrowing to buy stocks) likely eased in July as Technology stocks, particularly Semiconductors, pulled back. Even so, market rotation has broadened leadership and helped propel the S&P 500 to record highs — a seasonal pattern common during the summer months. The combination of market rotation and new highs indicates a strong bull market. In July, we raised our year-end S&P 500 target to 8,225. From a technical perspective, the recent breakout to new highs points toward 7,900–8,000. We do expect volatility to continue, so maintaining a balanced portfolio remains as important as ever.
Earnings Remain Exceptional
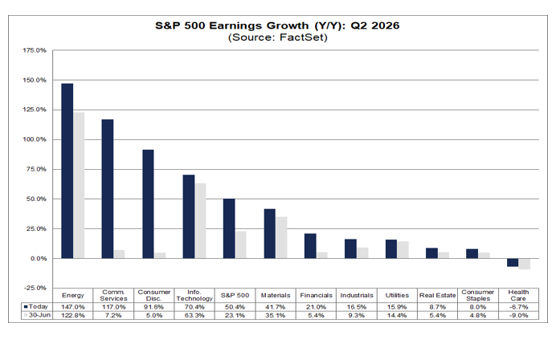
Second-quarter results are mind-bending. Energy led all sectors with estimated year-to-year earnings growth of 147.0%, helped by elevated refining margins. Communication Services grew 117.0% on cloud and AI monetization gains, helped by Alphabet (GOOGL), while Information Technology grew at 70.4% on a clean sweep of earnings beats in Hardware and Semiconductors. Materials rose 41.7% on higher commodity prices and industrial demand. Healthcare lagged at -6.7%.
By the end of last week, 88% of S&P 500 companies had reported results. So far, overall earnings growth is running at 50.4%, an exceptionally strong pace, particularly given that the economy appears to be in the mid-to-late stage of the business cycle. That strength in corporate earnings growth provides a solid fundamental foundation for the market's record highs, even as markets continue to navigate the conflict with Iran and the resulting higher oil prices.
We continue to believe the economy remains in the Inflation Boost phase, a concept we introduced in our May Monthly Report, in which moderate inflation supports pricing power, revenue growth, and ultimately stronger corporate earnings.
Earnings Per Share (EPS) Growth Year To Year For S&P 500 Sectors
Revenue Growth Confirms The Quality Of Earnings
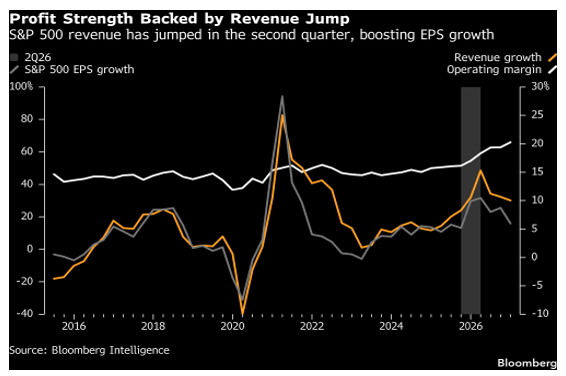
The earnings surge is genuine. Revenue growth accelerated by nearly 5%, while profit margins expanded at one of the fastest rates excluding the pandemic and the Global Financial Crisis (GFC). Even after filtering out unrealized investment gains, the data continue to show robust underlying earnings growth.
Profits And Revenue Remain Strong
Labor Market Surprisingly Softens
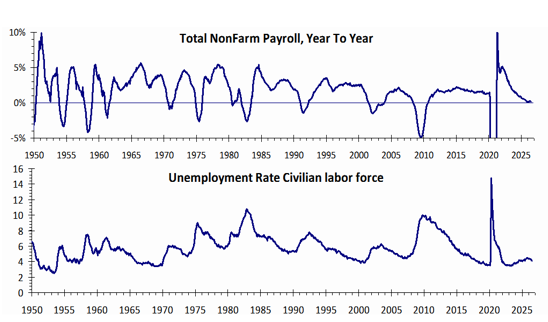
The July jobs report showed a loss of 23,000 positions against expectations of an 80,000 gain. Prior months were also revised lower. July seasonal adjustments are notoriously hard to model because of school calendars and summer patterns. The data also shows the unemployment rate remains low at 4.1%.
The data indicate a low-hire, low-fire environment rather than widespread layoffs. Emigration has replaced strong immigration flows. An aging population with Baby Boomers retiring continues to reduce the share of people working or looking for work.
This softens the case for near-term rate increases by the Federal Reserve (Fed). It also underscores the importance of productivity to economic growth.
Nonfarm Payrolls Barely Growing Year To Year, Unemployment Remains Low
Productivity Improves
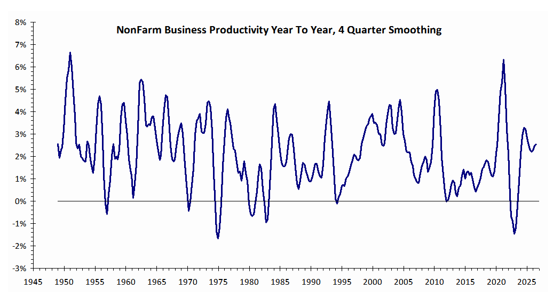
Second-quarter productivity rose 1.4% at an annualized rate, well above analysts’ expectations of 0.6%. We had anticipated continued improvement in productivity; many on Wall Street had not. We believe that AI is beginning to lift output per worker.
Higher productivity helps companies grow profits without adding as many employees. That supports the earnings strength we are seeing and is constructive for equity prices over time.
Productivity Is Strong And Still Rising
Margin Debt And Speculation
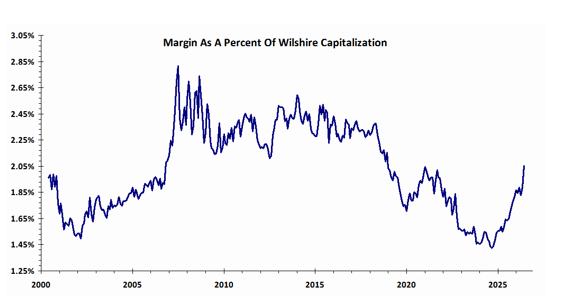
Margin debt relative to the Wilshire Index, a broad measure of total U.S. stock market value, climbed from 1.43% in September 2024 to 2.05% in June 2026. That rapid rise accompanied higher equity prices and signaled increased speculation. As Technology stocks, particularly Semiconductors, corrected sharply during July, margin debt likely declined as investors reduced leverage. Even so, margin debt remains low relative to historical levels (see accompanying chart).
Lower leverage reduces the risk of forced selling during periods of market stress and provides a healthier backdrop for the broader equity market.
Margin As A Percent Of Market Capitalization Rose Sharply Through June
Semiconductors Near A Turning Point
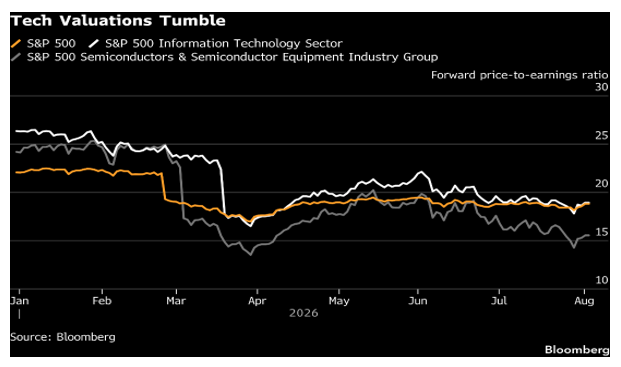
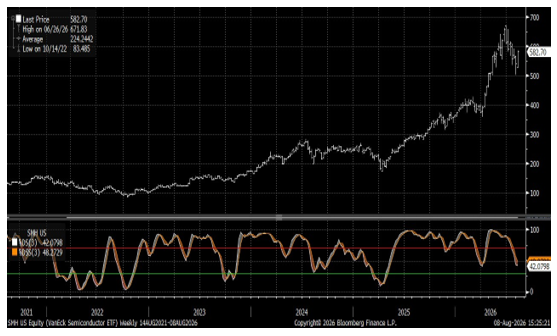
Semiconductor stocks have experienced a 20%–30% correction driven by deleveraging, as we expected. The sell-off has made valuations in the sector more attractive, and Semis now trade at a lower forward price-earnings multiple than the broader market. Semis responded to the short-term near oversold reading we highlighted last week. The weekly stochastic has not yet generated a buy signal, though we believe conditions are approaching one. We remain bullish on Semis.
A successful stabilization would broaden market leadership beyond the largest Technology names and could support further market gains.
Semi Stocks Cheaper Than The Market!
VanEck Semiconductor ETF (SMH) (Top) With Weekly Stochastics (Bottom)
Metals and Mining Have Bottomed
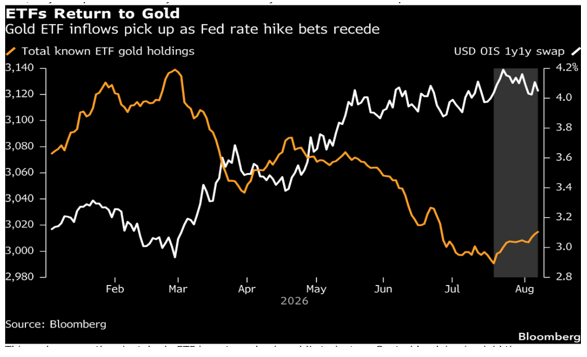
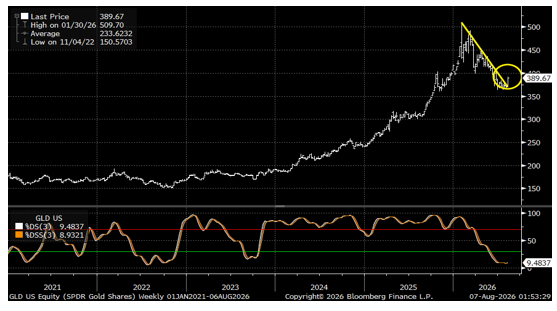
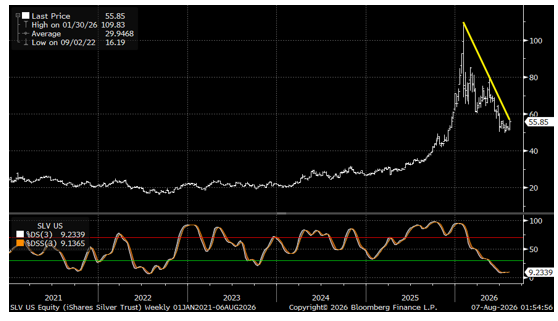
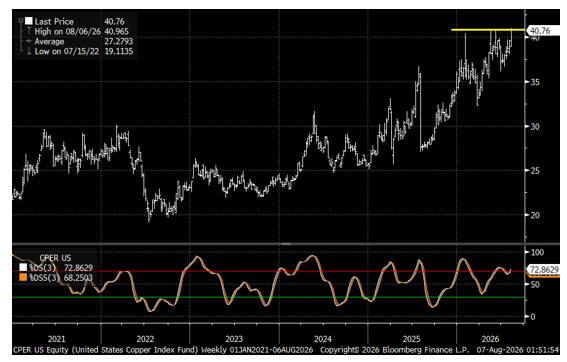
We believe Gold and Silver have bottomed. Copper continues to look stronger because of real demand from data-center construction, re- industrialization, and electric power needs.
Gold and Silver are extremely oversold and we anticipate a buy signal soon.
Industrial metals exposure offers a way to participate in physical demand tied to technology infrastructure.
Money Flows Moving Back To Gold
SPDR Gold Shares (GLD) (Top) With Weekly Stochastics (Bottom)
iShares Silver Trust (SLV) (Top) With Weekly Stochastics (Bottom)
U.S. Copper Index Fund (CPER) (Top) With Weekly Stochastics (Bottom)
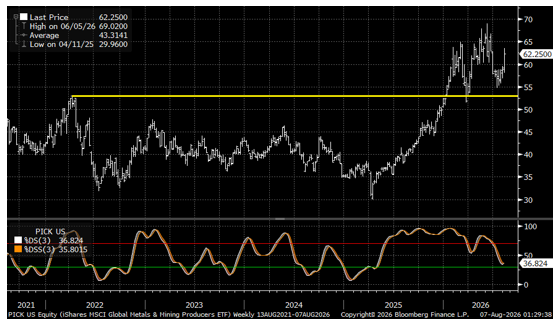
Global Metal Stocks Remain In Bull Market
The iShares MSCI Global Select Metals & Mining Producers ETF (PICK) holds more than 75% in metals and mining companies and about 20% in steel.
iShares MSCI Global Select Metals & Mining Producers ETF (PICK) (Top) Weekly With Stochastics (Bottom)
International And Emerging Markets Remain In An Early Secular Bull Market
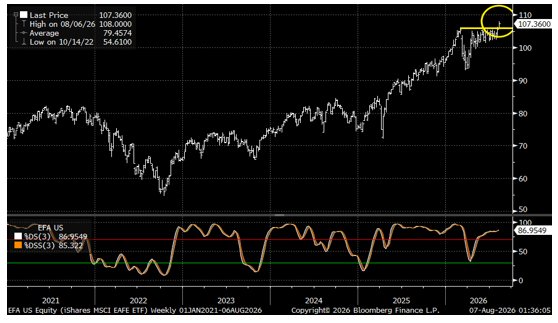
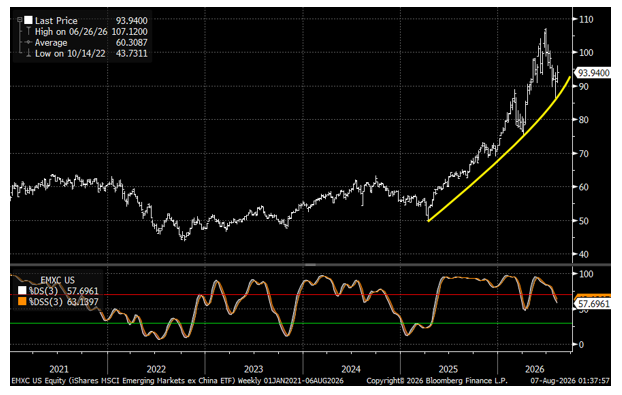
The global secular bull market continues. The iShares MSCI EAFE ETF (EFA), which tracks developed markets outside the United States and Canada, has reached a new all-time high. The MSCI Emerging Markets ex-China Index (EMXC) remains in an uptrend following its recent correction, which was largely driven by deleveraging in Semiconductor stocks.
Strength in international equity markets creates attractive diversification opportunities, particularly given the concentration of AI-related leadership within U.S. equity markets.
iShares MSCI EAFE ETF (EFA) (Top) With Weekly Stochastics (Bottom)
iShares MSCI Emerging Markets Ex China ETF (EMXC) (Top) With Stochastics (Bottom)
Small Caps And Equal-Weight S&P 500 Showing Leadership
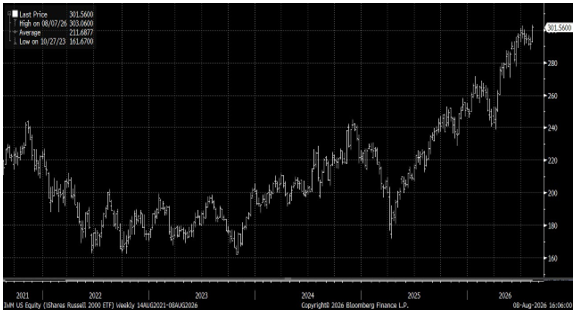
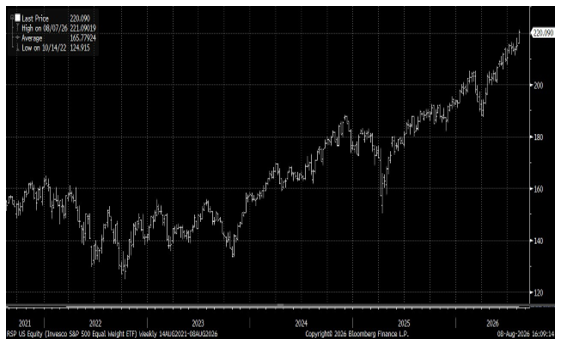
The Russell 2000, the standard measure of U.S. small-company stocks, hit a new all-time high along with the equal-weighted S&P 500. This shows broad participation in the market and is a healthier foundation for sustained gains than narrow leadership by a handful of giant companies.
Near-term risks include inflation data this week and possible consolidation after the recent advance. The longer-term combination of improving productivity, solid corporate revenues, and expanding market breadth remains constructive, in our view.
iShares Russell 2000 ETF (IWM) Breaks To New Record Highs
The equally weighted S&P 500 also reached a new high. This shows that sector rotation has lifted prices across more of the market while Technology and Semiconductors worked off earlier overbought and leveraged positions.
Invesco S&P 500 Equal Weight ETF (RSP) Hits New Record High
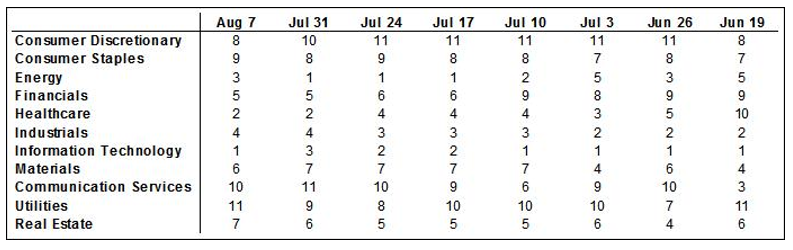
Sector Readings: Information Technology In First Place, Healthcare Second, Energy Third; Utilities In Last Place, Followed By Communication Services And Consumer Staples
Information Technology returned to first place last week, followed by Healthcare, with Energy dropping to third. The Tech correction appears to be completed. Utilities, which are sensitive to rising interest rates, dropped to last place, followed by Communication Services, then Consumer Staples, a defensive sector that prospers when the economy slows.
Our sector model analyzes S&P 500 GICS sector classifications, using a weighted measure of price momentum across three time periods. We rank each sector from best to worst based upon the average of its 40-, 26-, and 13-week relative price performances. We rank each sector from 1 to 11, with 1 being the strongest and 11 the weakest.
Sector Rankings By 40-, 26-, And 13-Week Average Relative Price Performance
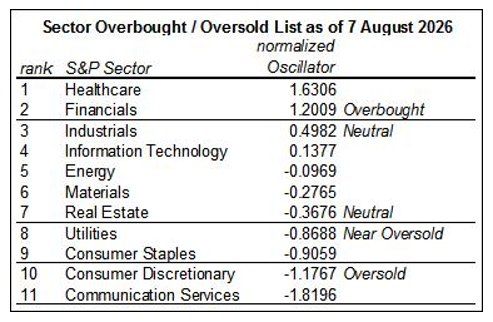
OBOS List: Healthcare And Financials Overbought. Communication Services And Consumer Discretionary Oversold; Consumer Staples And Utilities Near Oversold.
Healthcare was overbought once more last week along with Financials. Communication Services and Consumer Discretionary were oversold. Consumer Staples and Utilities were near oversold. There were no near overbought sectors. The extreme overbought and oversold conditions we have noted over the past several weeks have been relieved with the progression of the market’s rotation.
Our tactical sector rotation model uses the S&P 500 GICS sector classifications. We apply a 13-week rate of change methodology that normalizes the rankings from overbought (OB) to oversold (OS). An industry group is overbought when it has risen too far too fast, relative to the rest of the market, based upon its normal movement. Conversely, it’s oversold when it has lost too much too fast, relative to the rest of the market, based upon its normal movement. Over time, a sector tends to move back toward its normal rate of change, relative to the rest of the market. Overbought sectors tend to slow their pace of gains in relative price, while oversold sectors tend to improve in relative price until they reach their average performance again.
Here’s our methodology: the overbought-oversold table of sectors measures the 13-week rate of change in the relative price of each sector. We then average (i.e., smooth) this over 3 weeks and normalize the results. Normalized oscillator values over 1.0 are considered overbought, while those between 0.6 and 1.0 are considered near overbought. Normalized oscillator values below -1.0 are considered oversold, while those between -0.6 and -1.0 are considered near oversold.
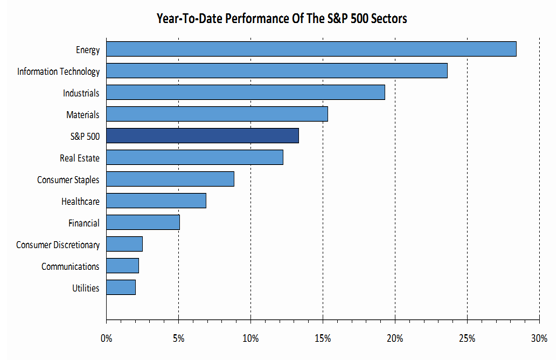
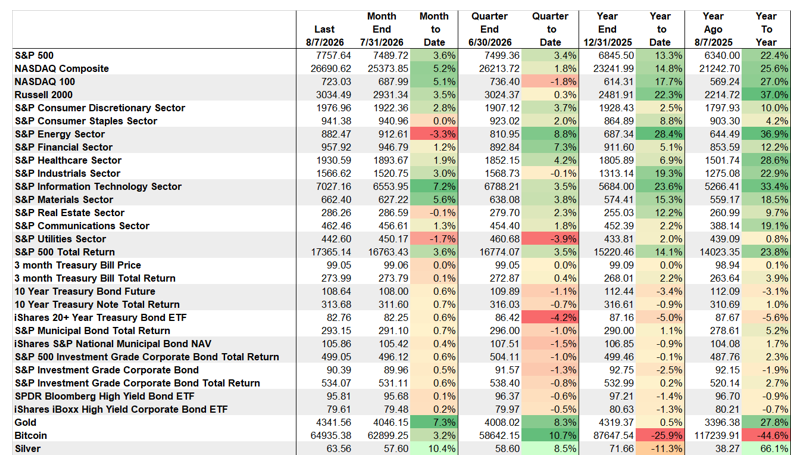
Market Performance: Energy Best Performing Asset, Followed By Information Technology And Russell 2000. Bitcoin Still Weakest.
Inflation Takes Center Stage
This week delivers important data on inflation and interest rate expectations.
This week brings the July Consumer Price Index (CPI) on Wednesday, Producer Price Index (PPI) on Thursday, and advance retail sales on Friday. Together, these reports will provide investors with important new signals on the economy, Federal Reserve policy, and the likely direction of interest rates. Markets will stay sensitive to ongoing Iran negotiations, while the remaining corporate earnings reports may help sustain the favorable backdrop for equities.
The Week's Calendar
MON
No events scheduled
EARNINGSEmbraer*
TUE
6:00 AMNFIB Index of Small Business Optimism
10:00 AMExisting Home Sales
11:00 AMFederal Reserve Bank of New York Q2 Household Debt and Credit Report published
EARNINGSCardinal Health, CoreWeave
WED
8:30 AMCPI
8:30 AMCore CPI, M/M%
8:30 AMCPI, Y/Y%
8:30 AMCPI Core, Y/Y%
2:00 PMMonthly Treasury Balance
EARNINGSCisco Systems
THU
8:15 AMFederal Reserve Bank of Cleveland President Beth Hammack speaks at the Dayton Area Chamber of
Commerce Government Affairs Breakfast series
8:30 AMWeekly Jobless Claims
8:30 AMPPI
8:30 AMEx-Food & Energy PPI, M/M%
8:40 AMFederal Reserve Bank of Richmond President Thomas Barkin speaks to the Greenville Chamber of
Commerce
EARNINGSApplied Materials
FRI
8:30 AMRetail Sales
10:00 AMManufacturing & Trade: Inventories
10:00 AMU. Michigan Prelim Consumer Survey
* Earnings reflect highlights Sources: MarketWatch/Kiplinger's

