

Source: Bloomberg, July 12, 2026 July 20, 2026 Last week, markets endured a mixed bag of softer inflation data, hawkish Federal Reserve (Fed) commentary, strong bank earnings, rising oil prices amid Iran tensions, and continued rotation out of Semiconductor chip stocks. While we expect near-term choppiness to persist, we believe that patient investors will be supported by underlying earnings resilience and ongoing, long-term secular trends.
Softer Inflation Data
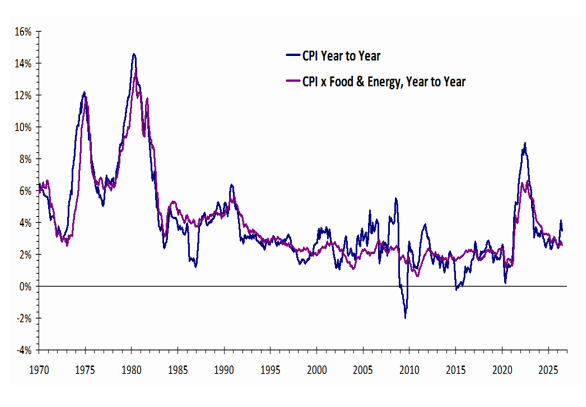
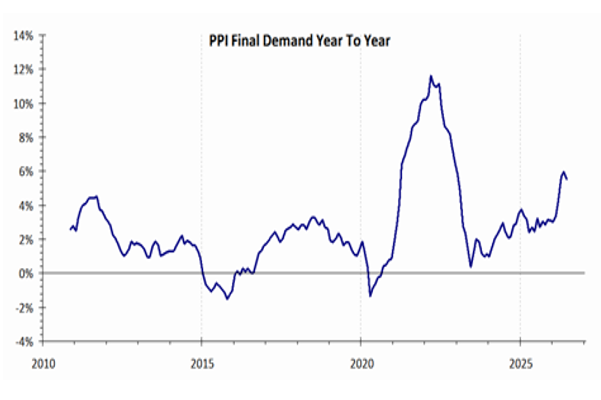
The June Consumer Price Index (CPI) — a key government measure of the average change over time in prices paid by urban consumers for a market basket of consumer goods and services — came in significantly weaker than expected by economists. This cooler reading helped push Treasury yields lower, lifting bond prices, which generally translates into reduced borrowing costs for mortgages, corporate loans, and other forms of debt. Lower yields can support stock valuations and interest rate-sensitive sectors in the near term. The Producer Price Index (PPI) — which measures changes in the prices producers receive for their goods and services — also came in below expectations, reinforcing the disinflationary signal from the CPI. These data points should give the Fed more flexibility on policy timing — including potential rate cuts later this year. While Fed rhetoric remains cautious, the data gives policymakers greater flexibility and leaves the door open to a range of interest rate outcomes in the second half of the year.
Both CPI And CPI Ex-Food & Energy Were Lower Than Expected
PPI Also Ticked Down, Surprising Markets
Warsh Congressional Testimony: Hawkish Tone
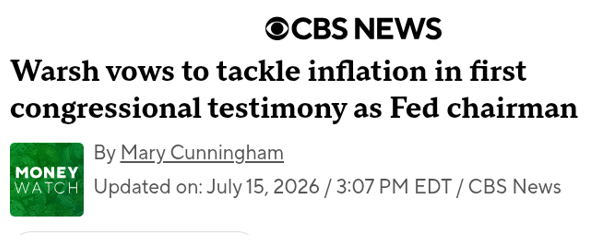
New Fed Chair Kevin Warsh delivered a notably hawkish message in his congressional testimony, stressing that inflation has remained too high for too long and rejecting any idea that the softer CPI signaled “mission accomplished” on reducing it. Warsh’s tone matched his comments during his first Federal Open Market Committee (FOMC) meeting. So far, investors have been encouraged by Warsh's firm stance on inflation.
Interest Rate Expectations
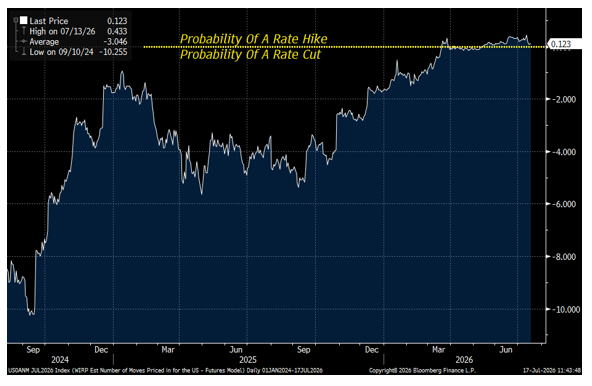
Markets began last week pricing in meaningful odds of a rate hike at the late-July FOMC meeting. After the softer inflation data was released, those expectations dropped sharply, with the probability of a near-term hike falling to roughly 10% by last Thursday’s close.
Probability Of An Interest Rate Hike Falls Toward 10%
Strong Bank Earnings Underpin Financials
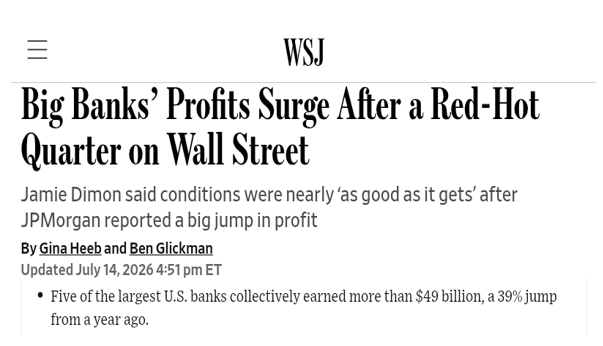
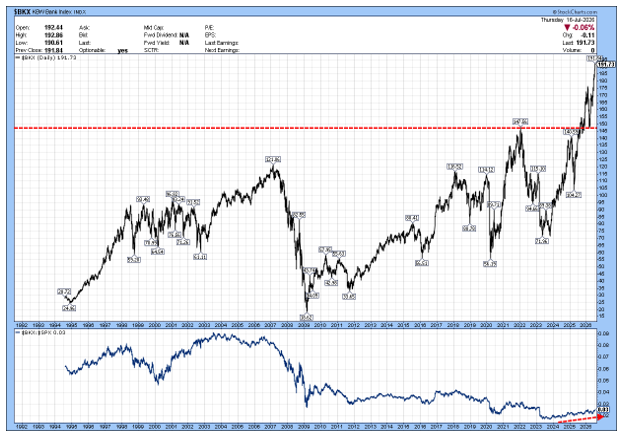
Last week, major U.S. banks kicked off the second-quarter earnings season with impressive results, as all eight large institutions in the S&P 500 index that reported beat Wall Street earnings expectations. Firms such as Goldman Sachs (GS) posted record revenue from equity trading, investment banking and initial public offerings (IPOs), while Bank of America (BAC) and others showed healthy gains in lending as well as investment banking activities. These beats reflect resilient consumer spending, steady loan demand in a higher-rate environment, and strong performance in capital markets businesses, including IPOs. (Remember, many of the banks recently raised their dividends.) These strong bank earnings offer reassurance about the underlying strength of the economy and our bullish outlook for the Banks sector overall. While near-term volatility from interest-rate uncertainty and geopolitical risks remains, these results underscore the sector’s ability to generate solid returns.

KBW Bank Index (Top) Relative Price (Bottom)
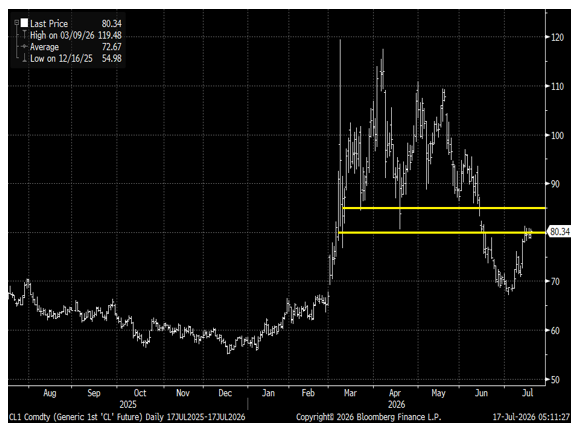
Oil Rises On Iran Tensions But Hits Resistance
Oil prices posted solid weekly gains last week, amid escalating tensions in the Persian Gulf, where U.S. strikes on Iran and disruptions to shipping through the critical Strait of Hormuz have once again raised supply concerns. West Texas Intermediate (WTI) crude oil — the primary U.S. oil benchmark — has climbed into the upper $70s to low $80s per barrel. There is significant resistance in the $80–85 per barrel range for WTI, and so far, the commodity has respected this level without breaking higher on a sustained basis. Higher oil prices support energy stocks, but they do feed into broader inflation worries. While geopolitical risks retain an upside potential in crude prices, the market’s adherence to technical resistance suggests that any further spikes may be capped for now. Investors should brace for continued volatility in energy prices. We continue to favor Energy companies, and 2Q earnings for the sector are expected to come in strong.
West Texas Crude Oil Price Respects Resistance At $80-$85
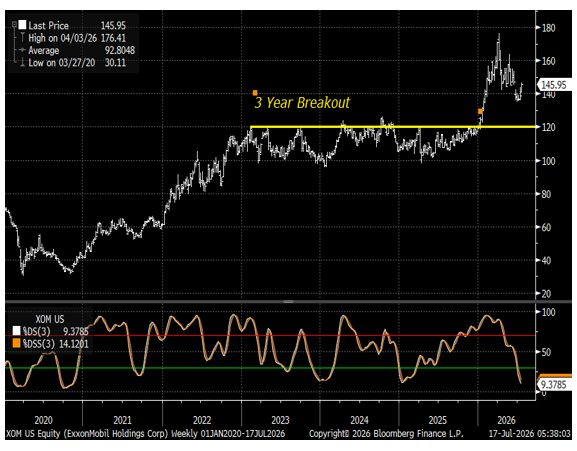
Major Oil Companies Benefit From Higher Prices And Strong Cash Flows
Integrated energy giants such as Exxon Mobil (XOM), Chevron (CVX), and Shell (SHEL) have been direct beneficiaries of the recent lift in crude oil prices, which boosts their upstream production revenues, while their refining and chemical businesses provide some natural hedge against volatility. Oil refiners also remain attractive, as constrained refining capacity can support refining margins. Many of these companies are generating robust free cash flow — cash left over after capital spending and dividends — which they are using for shareholder returns through buybacks, dividends, and selective acquisitions.
Exxon Mobil (XOM) (Top) With Stochastics (Bottom): Very Oversold
Defense Stocks Gain Relevance Amid Geopolitical Tensions
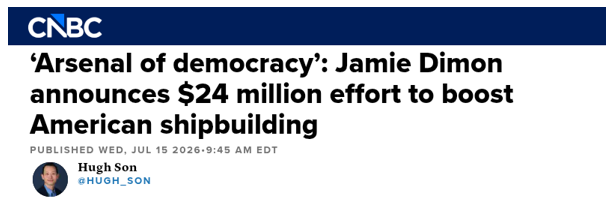
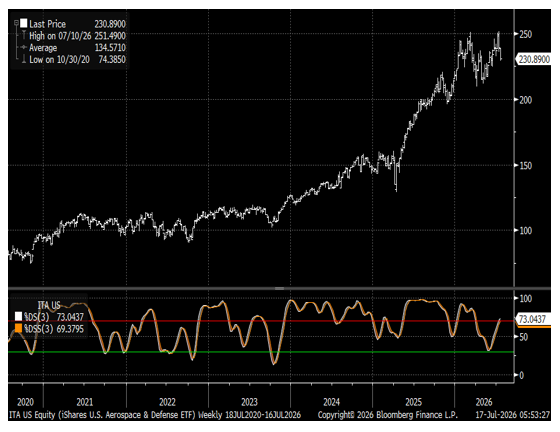
Rising geopolitical risks from the Iran conflict have highlighted the strategic importance of U.S. defense capabilities and domestic supply chains. With weapon stockpiles drawn down by support for Ukraine and military operations in the Persian Gulf, companies in the Aerospace & Defense sector stand to benefit from increased spending and accelerated production needs. JPMorgan Chase CEO Jamie Dimon has underscored this opportunity by directing the bank to invest its own capital and provide substantial financing for national security and related industries through its broader Security and Resiliency Initiative. The effort includes a $24 million investment in the Philadelphia Navy Yard. This environment underscores the long-term case for selective exposure to established defense names with strong backlogs and technological edges, even as near-term budget and procurement cycles can introduce volatility.
iShares U.S. Aerospace & Defense ETF (ITA) (Top) With Stochastics (Bottom
Technology Faces Rotation Amid AI Spending Concerns
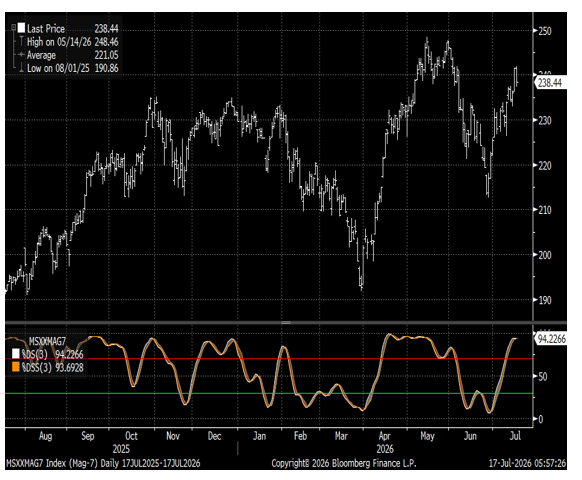
The Technology sector, a clear leader in the ongoing secular bull market, experienced notable rotation and pressure last week, with chipmakers and the broader group pulling back amid concerns over elevated capital spending, stretched valuations in select companies and high market leverage, particularly in the Semiconductor stocks. Semiconductor stocks had surged sharply, creating overbought conditions that invited profit-taking. Meanwhile, the Magnificent 7 — Apple (AAPL), Microsoft (MSFT), Nvidia (NVDA), Amazon (AMZN), Alphabet (GOOGL), Meta Platforms (META), and Tesla (TSLA) — had largely worked off their earlier outsized gains and, after becoming oversold, began to rally. Apple led the advance by reaching new record highs. This kind of volatility was expected. Earnings momentum remains robust, with the sector delivering strong guidance and superior growth prospects driven by artificial intelligence (AI) infrastructure demand. Any near-term weakness should be viewed as a potential opportunity to reposition into the clearest long-term winners with durable moats, strong cash flows, and proven execution in the AI buildout.
Magnificent 7 Index (Top) With Stochastics (Bottom)
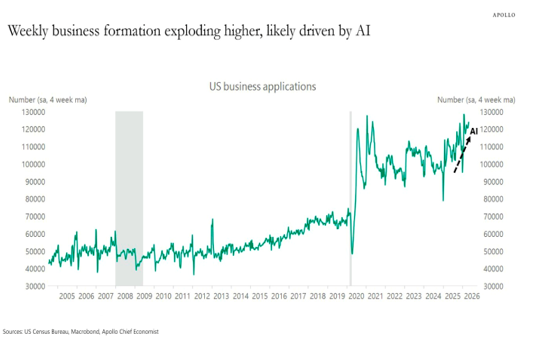
AI Boosts Business Formation and Job Creation
Artificial intelligence (AI) is proving to be a powerful force for new business creation rather than simply displacing jobs, according to Torsten Slok, chief economist at Apollo Global Management. Large language models (LLMs) and related tools are dramatically lowering the cost and complexity of launching companies, fueling a surge in the formation of new U.S. businesses — particularly solo and small operations in high-productivity sectors. This dynamic highlights AI’s broader economic lift: it not only drives infrastructure demand but also spurs entrepreneurship and future hiring. While short-term disruption in certain roles is real, the net effect supports long-term growth and reinforces the sector’s leadership in the secular bull market.
Moonshot Challenges U.S. Frontier Models
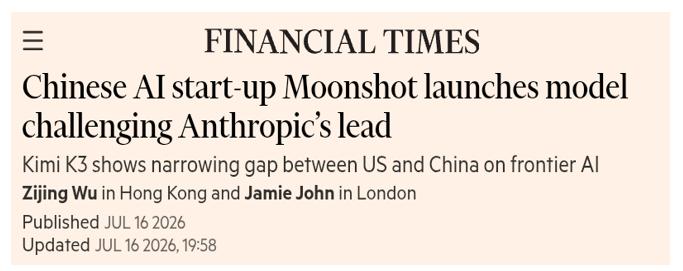
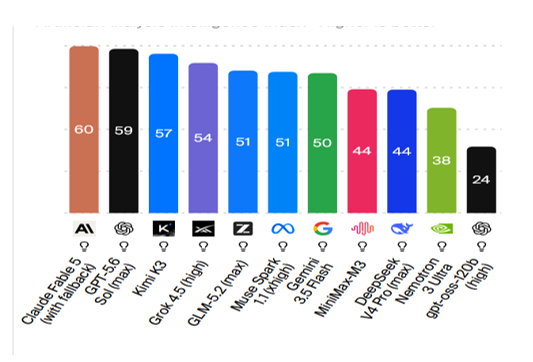
A frontier model is the most advanced large language model (LLM) available at a given time, pushing the boundaries of reasoning, coding, creativity, and complex problem-solving. Moonshot AI, a Chinese company, has attracted attention with its latest model, Kimi 3, which reportedly rivals leading U.S. models in context length and overall performance on certain benchmarks.
While Kimi 3 demonstrates China's rapid progress in AI, the broader risks to U.S. frontier model firms remain significant: intense global competition, rapid capability diffusion, and concerns over intellectual property practices. One flashpoint is distillation—training a smaller model using the outputs of a larger one—which U.S. companies argue can cross into IP infringement when proprietary model behavior is copied without authorization. Moonshot’s Kimi has sparked controversy for responses that occasionally mimic the style of models like Claude (Kimi has reportedly said, “Hi, I’m Claude”), though no definitive proof of direct copying has been established.
Near-term, developments like this can pressure U.S. frontier companies through heightened competition and valuation scrutiny, much as the DeepSeek releases earlier in the year triggered sell-offs in AI-related stocks despite the long-term innovation tailwinds. These episodes highlight the fast-moving nature of the AI race and the importance of focusing on firms with durable competitive advantages, strong execution, and clear paths to monetization amid global rivalry.
Artificial Analysis Intelligence Index – Higher is better
Artificial Intelligence Is Boosting New Business Formations
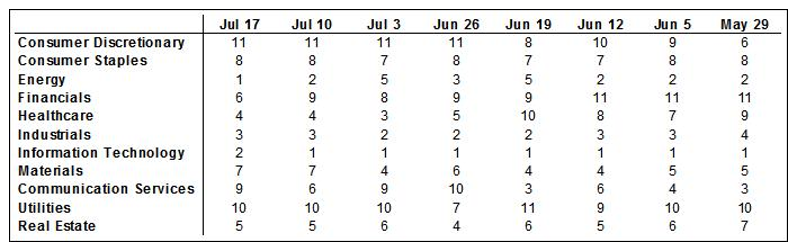
Sector Readings: Energy Now In First Place, Information Technology Second, Industrials Third; Consumer Discretionary Still In Last Place, Followed By Utilities
Energy moved to the top spot last week, followed by Information Technology which moved down a notch, indicating it may be weakening. Consumer Discretionary is in last place, followed by Utilities; these two have been in the same order at the end of the sector rankings for 3 weeks.
Our sector model analyzes S&P 500 GICS sector classifications, using a weighted measure of price momentum across three time periods. We rank each sector from best to worst based upon the average of its 40-, 26-, and 13-week relative price performances. We rank each sector from 1 to 11, with 1 being the strongest and 11 the weakest.
Sector Rankings By 40-, 26-, And 13-Week Average Relative Price Performance
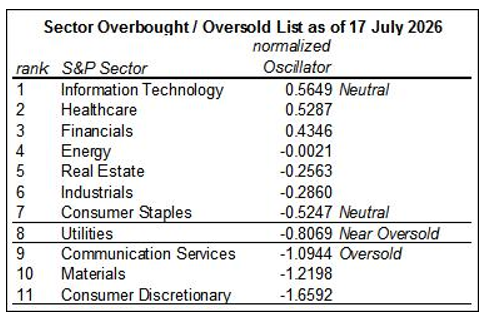
OBOS List: No Sectors Overbought, No Sectors Near Overbought. Consumer Discretionary, Materials, And Communication Services Oversold; Utilities Near Oversold.
No sector was overbought or near overbought last week. Consumer Discretionary, Materials, and Communication Services were oversold, while Utilities were near oversold.
Information Technology was either overbought or near overbought every week since April 17, 3 months or 13 weeks; last week it was neutral. There was at least one overbought sector every week since January 2, or 28 weeks; and there was at least one overbought or near overbought sector every week since October 31, 2025, 37 weeks. We believe this means that the market’s overbought condition may be easing at the least.
Our tactical sector rotation model uses the S&P 500 GICS sector classifications. We apply a 13-week rate of change methodology that normalizes the rankings from overbought (OB) to oversold (OS). An industry group is overbought when it has risen too far too fast, relative to the rest of the market, based upon its normal movement. Conversely, it’s oversold when it has lost too much too fast, relative to the rest of the market, based upon its normal movement. Over time, a sector tends to move back toward its normal rate of change, relative to the rest of the market. Overbought sectors tend to slow their pace of gains in relative price, while oversold sectors tend to improve in relative price until they reach their average performance again.
Here’s our methodology: the overbought-oversold table of sectors measures the 13-week rate of change in the relative price of each sector. We then average (i.e., smooth) this over 3 weeks and normalize the results. Normalized oscillator values over 1.0 are considered overbought, while those between 0.6 and 1.0 are considered near overbought. Normalized oscillator values below -1.0 are considered oversold, while those between -0.6 and -1.0 are considered near oversold.
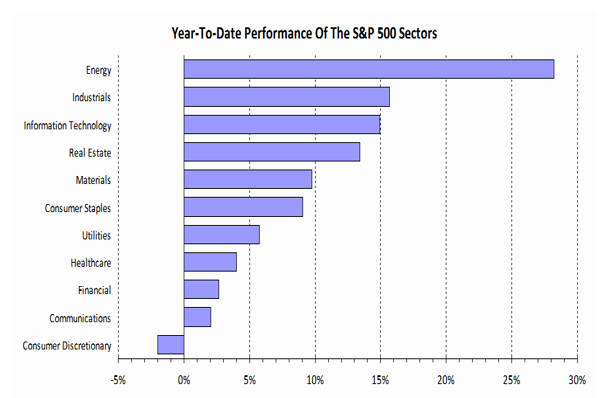
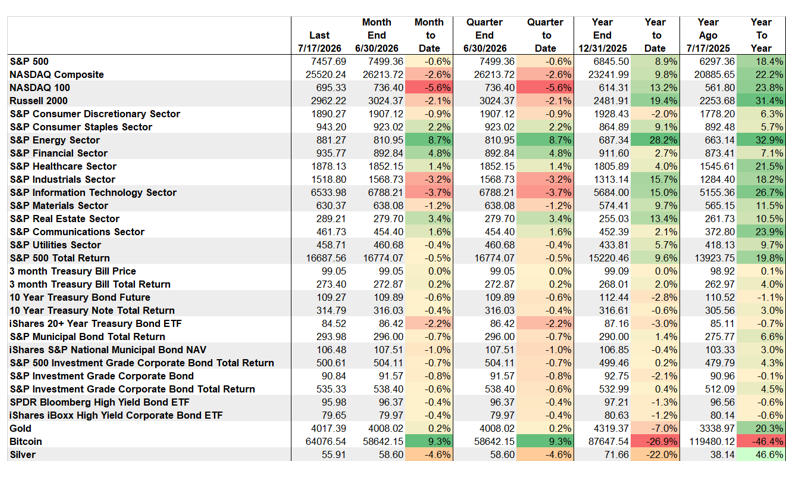
Market Performance: Energy Was The Best Performing Asset Year-To-Date, Followed By Russell 2000 And Industrials; Bitcoin Is Still Weakest, Followed By Silver
What To Watch This Week: Welcome to Hyperscalers Week
This is a week where earnings announcements should rise above economic data and geopolitical news.
This will be a week heavy with earnings — a veritable “hyperscalers week,” with major technology leaders, such as Alphabet (GOOGL) and Tesla (TSLA), reporting results alongside other important names including IBM (IBM), ServiceNow (NOW), Texas Instruments (TXN), and defense contractors like Lockheed Martin (LMT) and RTX (RTX), and several industrial and consumer companies. These earnings will be closely watched for updates on AI spending, cloud growth, vehicle and robotics demand, margins, and overall business confidence.
Investors will also see lighter economic data such as weekly ADP employment figures, flash Purchasing Managers’ Index (PMI) readings for manufacturing and services, weekly jobless claims, and new home sales, which should provide additional context on the health of the consumer and business activity.
On the geopolitical front, developments around the Iran conflict remain a key risk factor. While Gulf States have redirected much of their oil exports away from the Strait of Hormuz via pipelines, any escalation of military action could still pressure energy prices and broader risk appetite.
We believe that a solid set of earnings reports could reinforce confidence in the earnings-driven bull market, while any notable misses or cautious guidance might add to near-term volatility. Overall, we expect continued volatility but maintain patient optimism that strong fundamentals in leading sectors will prevail for the balance of the year – Remain Fearless!
The Week's Calendar
MON
10:00 AMLeading Indicators
3:30 PMFederal Reserve Board of Governors closed meeting
EARNINGSDomino's Pizza*
TUE
No events scheduled
EARNINGS3M
WED
No events scheduled
EARNINGSAlphabet, Tesla
THU
8:30 AMWeekly Jobless Claims
11:00 AMKansas City Fed Survey
EARNINGSIntel
FRI
9:45 AMUS Flash Manufacturing PMI
9:45 AMUS Flash Services PMI
10:00 AMNew Home Sales
EARNINGSAmerican Express
Sources: MarketWatch, Kiplinger's *Earnings reflect highlights

