
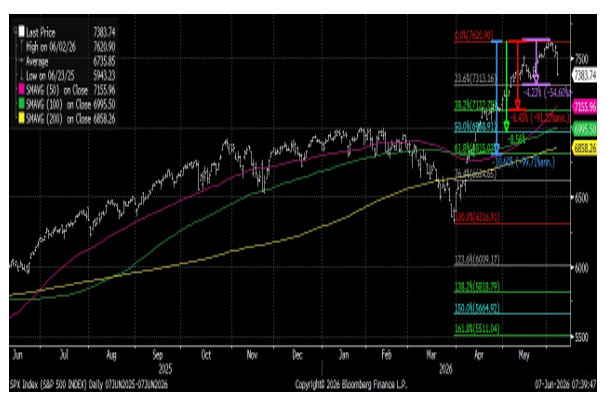
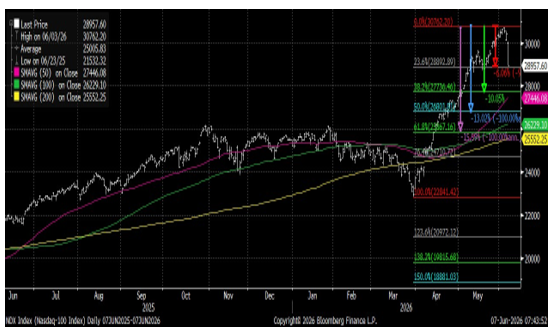
From their lows in March 2026, the S&P 500 has rallied 20% and the Nasdaq 100 has rallied 35% — which has created a very overbought market. We have been warning readers that a correction could be coming, noting: "Sell in May but come back." Well, here we are.
Last Friday, the May jobs report came in with much stronger job growth and significant upward revisions, reinforcing the view that the labor market remains more resilient than expected. This prompted investors to price in higher interest rates amid concerns that the Federal Reserve may need to raise rates later this year. The specter of higher rates spooked the market and caused a sharp correction — the S&P 500 dropped nearly 3% and the Nasdaq 100 was down 4%. Investors should brace for more volatility with Technology leading the correction. This could lead to a 10%–15% pullback, which should position equities for a rally through the summer months.
S&P 500 WITH FIBONACCI LEVELS AND MOVING AVERAGES
NASDAQ 100 WITH FIBONACCI LEVELS AND MOVING AVERAGES
Strong Jobs Data Raises Concern That the Fed May Raise Interest Rates
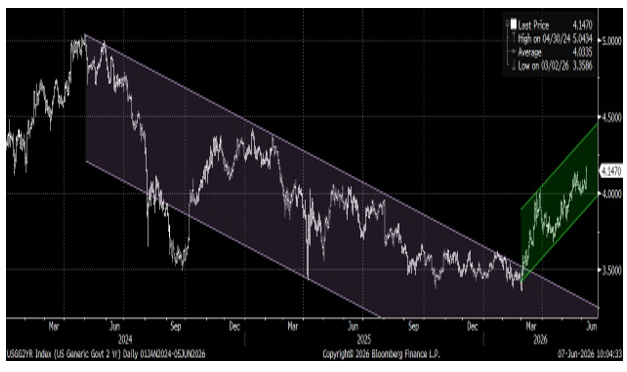
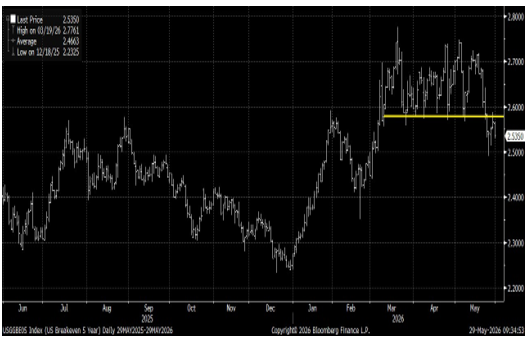
The strong jobs data raised concerns that the Fed may need to raise interest rates as the economy remains resilient and the labor market is showing signs of renewed strength. The May jobs numbers were much better than expected, with April payrolls revised sharply higher. In response, Treasury yields moved higher across the curve, though the 2-year Treasury yield is often viewed as the market's best indicator of the expected path of Fed policy. Meanwhile, persistently higher oil prices continue to add to inflation concerns, providing little relief for the rates market.
2-YEAR TREASURY YIELD SPIKES HIGHER ON JOBS DATA
5-YEAR BREAKEVEN: INFLATION EXPECTATIONS FALLING
Tactical Sell Signal
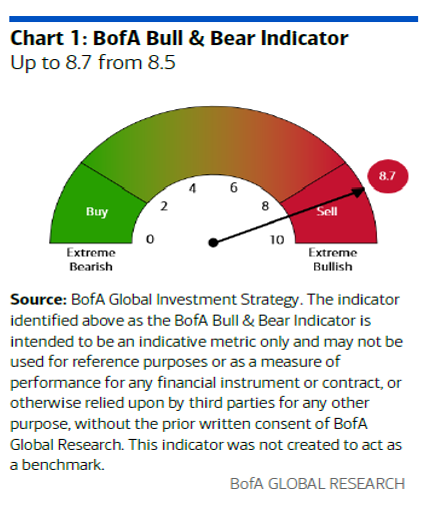
Last week we highlighted that the Bank of America Bull & Bear Indicator was in the sell zone, signaling the equity market was at risk of a correction. We are now into the correction, which is likely to last a few weeks. It's possible the market bottom comes as the SpaceX initial public offering (IPO) is launched. Read the June edition of our monthly report, SpirePoint Corner, to learn more about this record-breaking IPO.
BOFA BULL & BEAR INDICATOR DEEPER INTO TACTICAL SELL SIGNAL
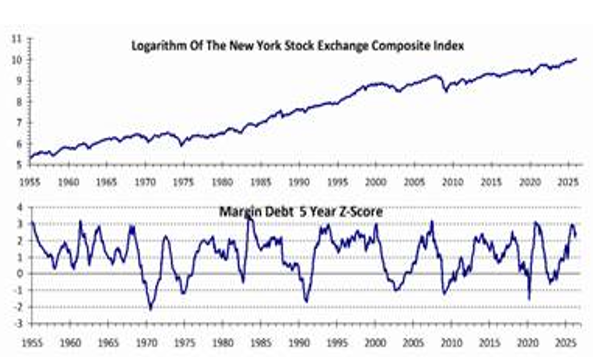
NYSE Margin Debt Elevated & Deleveraging Likely Underway
Margin debt tends to increase alongside rising equity markets and is currently at elevated levels. When debt levels are high, market pullbacks can become more severe as investors are forced to reduce or sell positions to meet margin requirements. This dynamic may have contributed to last Friday's sharp selloff. Remember, equity markets often behave like roller coasters — they tend to climb gradually but can fall quickly and abruptly.
NYSE MARGIN DEBT AT ELEVATED LEVELS EXACERBATING DOWNSIDE
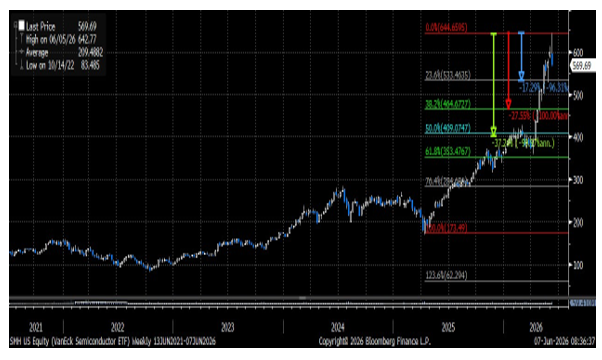
Semiconductors Lead the Correction
What goes up the most generally comes down the most. Semiconductors have been the leading industry group of this bull market and have rallied 270% since the low in April 2025 (during the tariff tantrum) and 80% since the March low. These returns are extraordinary and have created a very overbought market condition. Semis are now in a correction, and it can be sharp given how much the group has rallied. Investors should be positioned for at least a 20%–30% pullback. We remain buyers of semis and maintain they are the leader of this secular bull market.
VANECK SEMICONDUCTOR ETF WITH FIBONACCI LEVELS
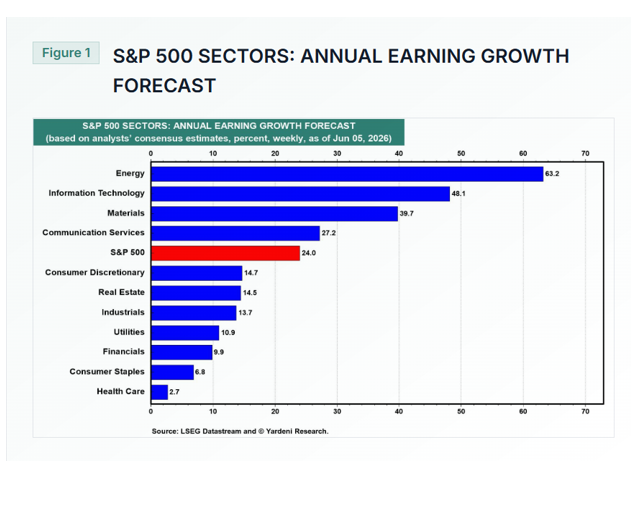
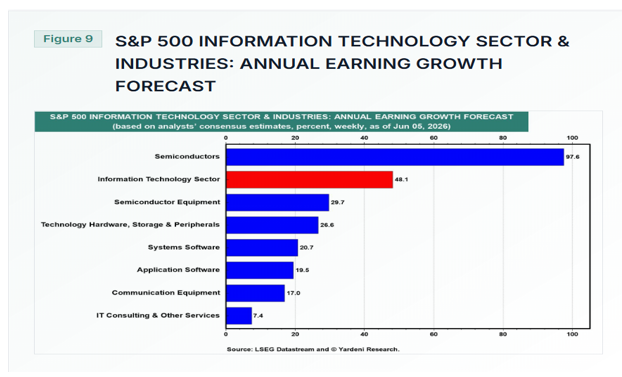
Earnings Support Leadership in Technology & Semis
Earnings continue to support leadership within the Technology sector, with semiconductor stocks delivering the strongest growth rates. As a result, we view the recent weakness as a normal correction following a significant rally rather than the beginning of a more prolonged downturn.
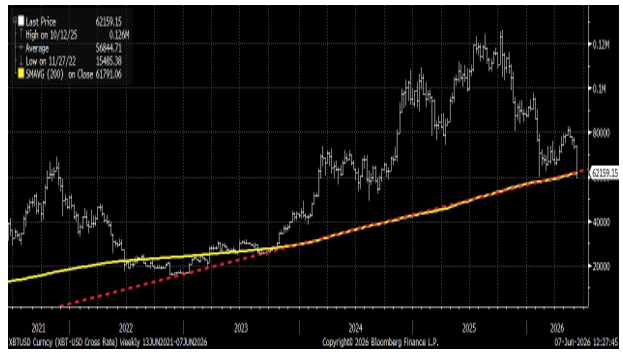
Bitcoin Continues to Remain in a Bear Correction
Bitcoin is testing critical support at the 200-day moving average and its uptrend line near $61,791. Failure to hold support indicates another leg down in the correction approaching the $40,000 level.
BITCOIN TESTING 200-DAY MOVING AVERAGE & TRENDLINE
SpaceX IPO and Nasdaq Index Mechanics
SpaceX is positioned to complete the largest IPO in history, with pricing expected on June 11 and trading to begin June 12. The company aims to raise around $75 billion at a roughly $1.75 trillion valuation, surpassing Saudi Aramco's 2019 record of nearly $30 billion. At launch, only about 555.6 million new shares will be available to the public — roughly 3%–5% of SpaceX's total shares outstanding (approximately 12.9 billion). In comparison, Saudi Aramco floated 1.5% of its shares.
Nasdaq is adding SpaceX (SPCX) at an extraordinarily swift pace. The exchange altered its rules effective May 1, 2026, shortening the waiting period for large new listings to join the Nasdaq-100 Index from several months to just 15 trading days. It also removed the old 10% minimum free-float requirement and plans to apply a special 3x float multiplier for low-float stocks, like SpaceX, when calculating index weight.
This thin float relative to the $1.75 trillion valuation is one reason for the special Nasdaq rule changes and the anticipated high volatility. By contrast, S&P Dow Jones Indices is not bending its standard 12-month seasoning rules before considering inclusion, and will make a decision on S&P 500 inclusion at a later date.
Sector Readings: Information Technology Remains Strongest; Financials Remain Weakest
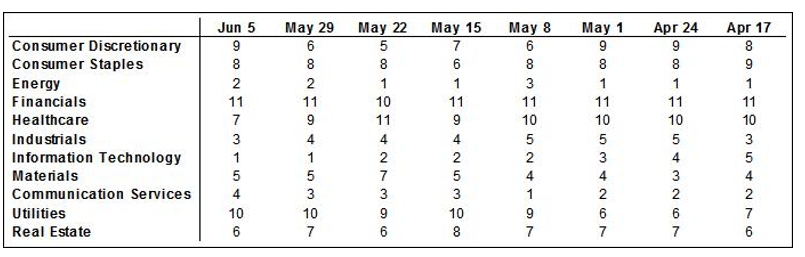
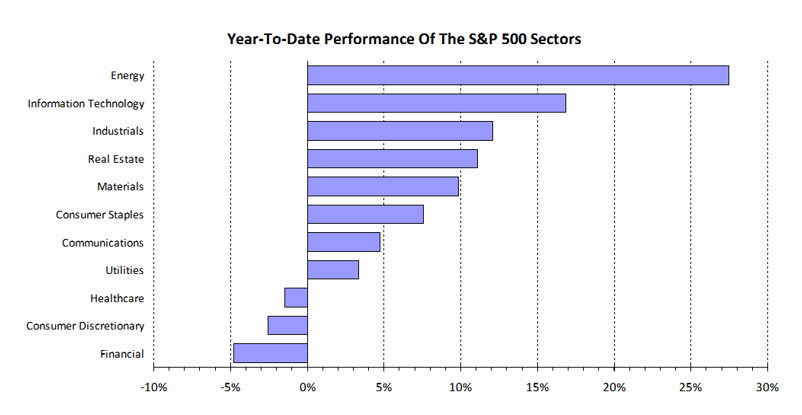
Information Technology is still in first place, followed by Energy and Industrials. Likewise, Financials are still in last place, followed by Utilities. Energy has been among the top three sectors for 26 weeks — half a year — while Financials have been one of the two weakest sectors for 17 weeks, more than a quarter.
Our sector model analyzes S&P 500 GICS sector classifications, using a weighted measure of price momentum across three time periods. We rank each sector from 1 to 11 based upon the average of its 40-, 26-, and 13-week relative price performances, with 1 being the strongest and 11 the weakest.
SECTOR RANKINGS BY 40-, 26-, AND 13-WEEK AVERAGE RELATIVE PRICE PERFORMANCE
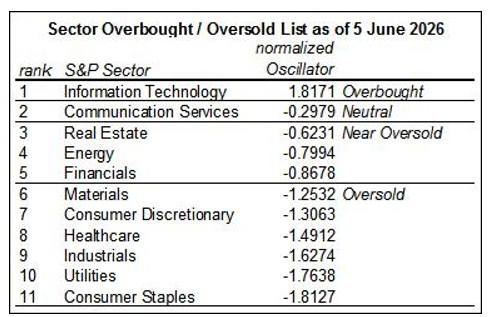
OBOS List: Information Technology Remains Overbought
Despite last Friday's sharp correction, Information Technology is still overbought. Consumer Staples, Utilities, Industrials, Healthcare, Consumer Discretionary, and Materials are all oversold, while Financials, Energy, and Real Estate are near oversold. There remains an extreme overbought and oversold reading among the rankings of the sectors. This most likely can cause continued volatility — especially from the Technology sector as it corrects from being so overbought — and most likely sets up a major sector rotation.
Our methodology: the overbought–oversold table measures the 13-week rate of change in the relative price of each sector, averaged over 3 weeks and normalized. Normalized oscillator values over 1.0 are considered overbought (0.6 to 1.0 near overbought); values below −1.0 are oversold (−0.6 to −1.0 near oversold). Over time, a sector tends to move back toward its normal rate of change relative to the rest of the market.
Inflation Data & SpaceX IPO to Grab Headlines This Week
This week brings important inflation data, with the May Consumer Price Index due Wednesday and the Producer Price Index due Thursday. These reports will be watched closely for signs of sticky price pressures amid recent oil volatility, as inflation remains the primary concern of Federal Reserve hawks. Earnings season continues with software and cloud companies — Oracle and Adobe report midweek, and investors will be looking for evidence that their AI investments are translating into business results. The SpaceX IPO roadshow and market debut will continue to attract massive attention, while geopolitical developments could reignite volatility in oil markets. The week also marks the Federal Reserve's communications blackout ahead of the June 16–17 FOMC meeting — so there should be no public remarks from Fed officials. But outside of this quiet period for the Fed, we expect the markets to be noisy!
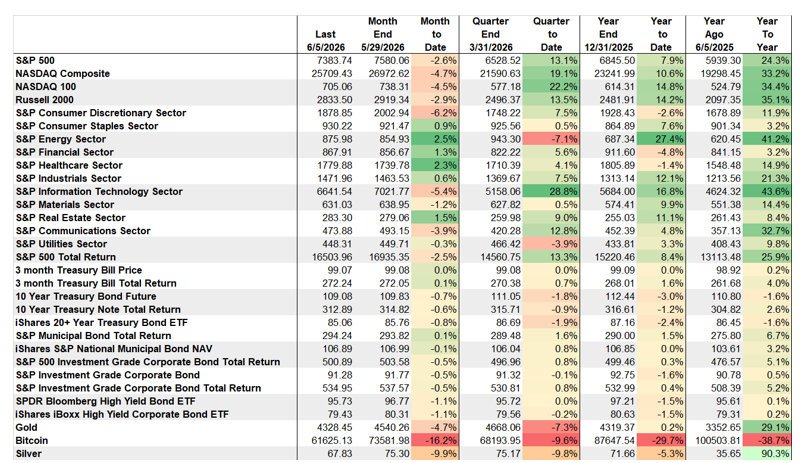
MARKET PERFORMANCE: ENERGY REMAINS BEST PERFORMING ASSET YEAR-TO-DATE
The Week's Calendar
MON
None scheduled
TUE
6:00 AMNFIB Small Business Optimism
10:00 AMMonthly Wholesale Trade
10:00 AMExisting Home Sales
WED
8:30 AMCPI, CPI Y/Y%, Core CPI Y/Y%
2:00 PMMonthly Treasury Balance
EARNINGSOracle
THU
8:30 AMWeekly Jobless Claims
8:30 AMPPI, Ex-Food & Energy PPI, Personal Consumption
EARNINGSAdobe
FRI
10:00 AMU. Michigan Prelim Consumer Survey
