
This pushed interest rates lower, particularly the 2-Year Treasury yield. The bumper crop of earnings that has been announced so far is averaging 30% above expectations – this is powering stocks to record highs. If this level remains as the actual “beat number” for the quarter, it will mark the highest earnings surprise reported by the S&P 500 index since FactSet began tracking this metric in 2008. Earnings are up 51% year over year, putting the index on track for a second consecutive quarter of earnings growth above 25% and a seventh consecutive quarter of double-digit growth. Revenues for the quarter rose more than 15% year over year, the strongest pace since the fourth quarter of 2021. Five sectors delivered at least double-digit revenue growth: Energy, Information Technology, Communication Services, Financials, and Real Estate.
Consumer Price Inflation Data Easing
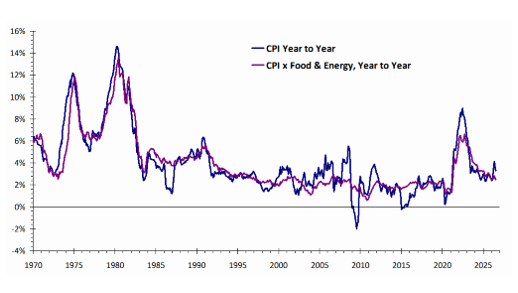
The July CPI report showed headline inflation rising just 0.1% month over month and 3.4% year over year. The surprise was that the previous month’s reading was revised down to – 0.4%. Core CPI (excluding food and energy) advanced 0.2% month over month and 2.5% year over year, the slowest annual core reading since early 2021. The softer inflation data eased concerns about interest rate hikes later this year.
CPI And CPI Less Food And Energy Year Over Year
PPI Confirms The Disinflationary Trend
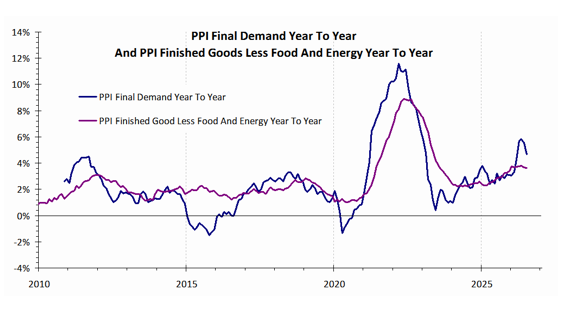
The Producer Price Index (PPI) came in below expectations, with the month-over-month reading at 0.0%, versus the expected 0.2%, and the year-over-year reading at 4.7%, below the expected 4.9%. PPI excluding food and energy came in slightly above expectations, but the market focused on the softer overall data. Declining energy and food input costs are feeding through to wholesale prices, giving the Federal Open Market Committee (FOMC) additional flexibility on interest rate decisions. The market continues to lower expectations of an interest rate hike this year.
PPI Final Demand And PPI Final Demand Less Food And Energy Year To Year
Retail Sales Come in Significantly Below Expectations
July retail sales came in significantly below expectations, declining 0.6% versus expectations for a 0.1% increase. A lower-than-expected number could be due to a drop in sales following the World Cup, which ended on July 19. This surprise is lowering interest rates while pushing out an expected interest rate hike. We believe Federal Reserve Chair Kevin Warsh is more likely to favor cutting interest rates than raising them, and the latest data increasingly supports that view.
Wage Growth Is Falling Which Should Ease Inflation
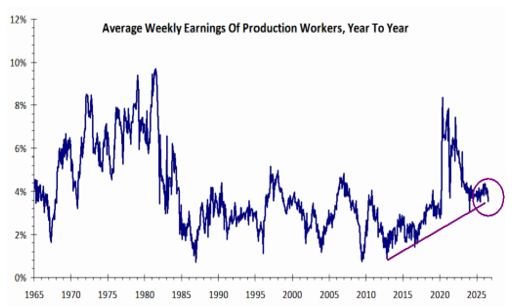
Annual growth in weekly earnings of production workers continues to slow. Weaker wage pressures reduce one of the key arguments for additional rate increases and support the outlook for lower front-end yields. Wage growth is a key indicator of future inflation, and slowing wage growth signals that inflation should ease in the months or quarters ahead.
Annual Growth Weekly Earnings Of Production Workers Is Weakening
Two-Year Treasury Yields Breaking Down
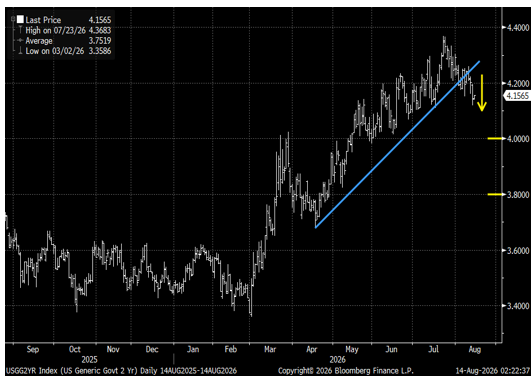
Last week, we highlighted that the 2-Year Treasury yield appeared to be breaking down, but we needed confirmation. We got it from the weaker inflation and retail sales data. Our target is a move toward 4.0%–3.8%. Lower interest rates are supportive of higher stock prices. Historically, the trend in the 2-Year has foreshadowed the direction of Fed interest rate policy.
Two-Year Treasury Yields Are Declining
The Odds Of A Near-Term Rate Hike Are Receding
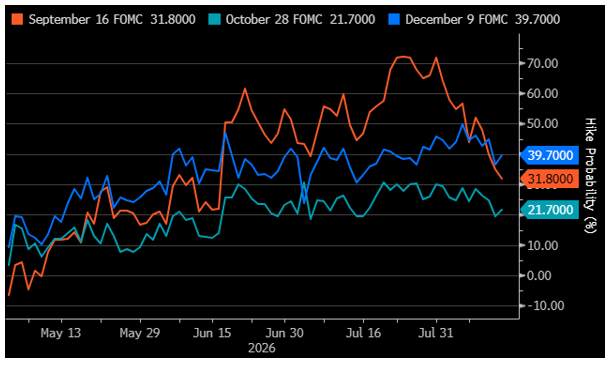
Market-implied odds of a 25-basis-point hike at the September, October, and December FOMC meetings have retreated sharply following this week’s soft inflation reports. September probability has fallen from a mid-July peak near 72% to roughly 32%. The term structure now shows December higher than September, suggesting the market sees a higher chance the Fed skips a hike at the September meeting and potentially acts later, if needed.
Implied Probabilities Of A 25 Basis Point Rate Hike At The September, October, And December FOMC Meetings
Earnings Are Extraordinarily Strong Across Sectors
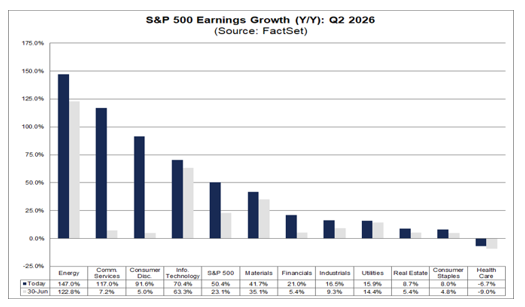
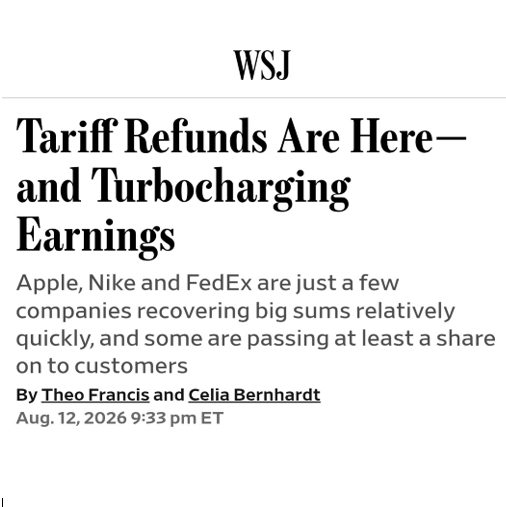
Ten of the eleven S&P 500 sectors reported positive year-over-year earnings growth in the second quarter. Only the Healthcare sector had a decline in earnings. Energy and Communication Services had year-to-year earnings growth above 100%. Consumer Discretionary and Technology followed with 92% and 70% earnings growth, respectively — also extremely strong results. Part of the strength in 2Q earnings is coming from tariff refunds.
Earnings Growth Year-To-Year 2Q 2026 Up Dramatically
Revenue Growth Remains Powerful
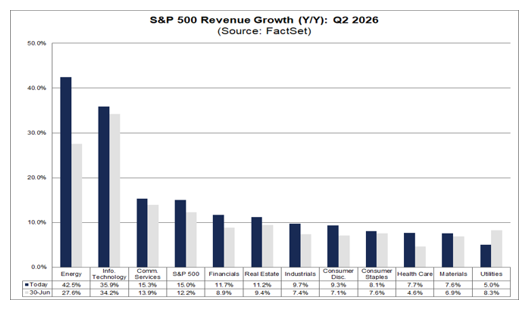
S&P 500 revenue growth for 2Q26 reached 15% year over year, the highest pace since the fourth quarter of 2021. Energy led with more than 40% growth, followed by Information Technology with 36%. Strong top-line expansion provides a solid foundation for continued earnings momentum. Business backlogs have been rising, indicating demand remains strong within the economy.
Net Earnings Revisions Rise Sharply
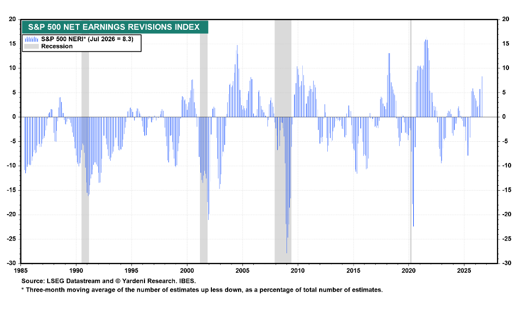
Analyst net earnings revisions continue to rise substantially, supporting higher stock prices in the months ahead. Seasonally, earnings estimates tend to fall as we move into the third and fourth quarters. Estimates rising sharply now point to the strength of earnings power in this AI-driven business cycle. Revisions to earnings estimates are the strongest models for predicting the direction of stock prices. The rate of increases in earnings estimates for the S&P 500 is a strong confirmation that we remain in a secular bull market. Our S&P 500 target for this year is 8,225, which was raised up in June from 7500.
Net Earnings Revisions Rising Sharply, A Positive Sign For Stocks
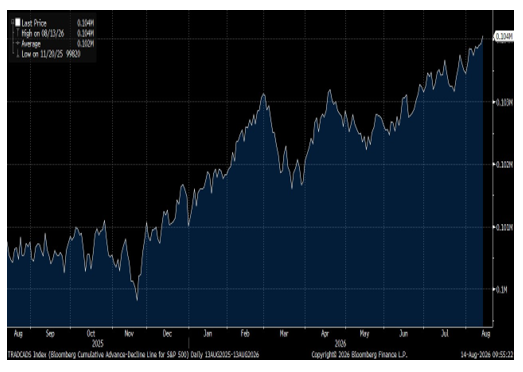
Market Breadth Confirms Record Highs In Stocks
The S&P 500 cumulative advance-decline line has reached a new all-time high. Broad participation across stocks reduces the risk of a narrow, fragile rally and reinforces the secular uptrend.
S&P 500 Cumulative Advance-Decline Hits Record High
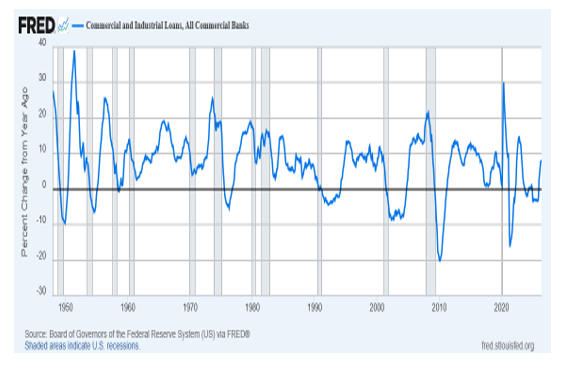
Commercial And Industrial Loans Support Expansion
Commercial and Industrial (C&I) loans are expanding at an 8% annual rate. This indicates ongoing business investment and credit demand, consistent with an expanding economy, even if the pace remains below prior cycle peaks. This is bullish for bank earnings going forward.
C&I Loans Are Rising At 8% Annually
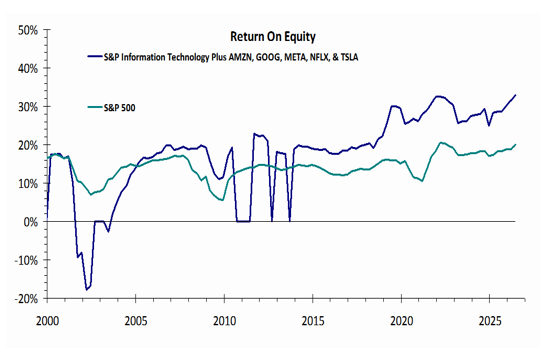
Return on Equity Favors Technology
Return on Equity (ROE) is a key measure of how efficiently a company generates profits from shareholders’ capital and one of Warren Buffett’s preferred indicators of business quality. At 33%, ROE among Technology stocks remains substantially higher than the 20% for the broader S&P 500. This differential continues to support the sector’s long-term leadership within the secular bull market.
Return On Equity Is Stronger Among Technology Stocks Than The Rest Of The Market
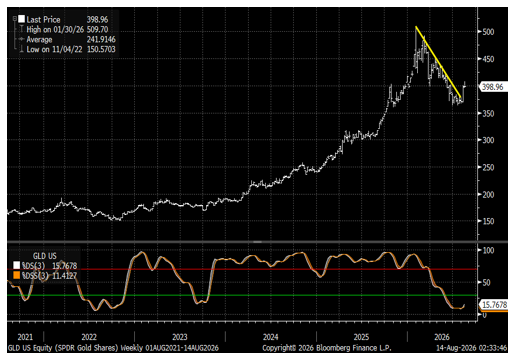
Gold Appears to Have Bottomed
Our technical analysis suggests gold prices have found a base near $4,000. The SPDR Gold Shares ETF (GLD) and related stochastic oscillators point to a very oversold and improving price momentum following the recent correction. We maintain a target on Gold of $5,000. We believe Gold is a good hedge to have in portfolios.
SPDR Gold Shares ETFs (GLD) (Top) With Weekly Stochastics (Bottom)
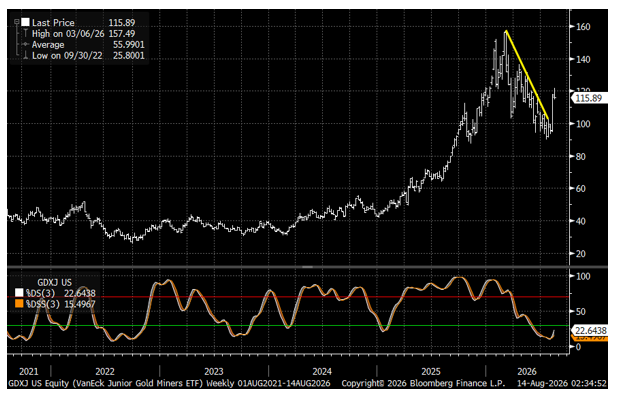
Junior Gold Miners Offer Leverage To Higher Gold Prices
Gold mining equities, particularly the more leveraged junior producers, stand to benefit if Gold prices resume their advance. The VanEck Junior Gold Miners ETF (GDXJ) shows similar technical oversold conditions, with price momentum starting to turn positive.
VanEck Junior Gold Miners ETF (GDXJ) (Top) With Weekly Stochastics (Bottom)
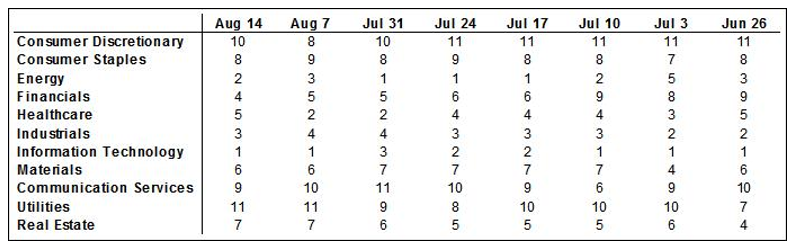
Sector Readings: Information Technology First, Followed By Energy And Industrials; Utilities Still In Last, Then Consumer Discretionary And Communication Services
Information Technology retained its first place last week, followed by Energy and Industrials. Utilities remained in last place; Consumer Discretionary and Communication Services brought up the next two bottom slots.
Our sector model analyzes S&P 500 GICS sector classifications, using a weighted measure of price momentum across three time periods. We rank each sector from best to worst based upon the average of its 40-, 26-, and 13-week relative price performances. We rank each sector from 1 to 11, with 1 being the strongest and 11 the weakest.
Sector Rankings By 40-, 26-, And 13-Week Average Relative Price Performance
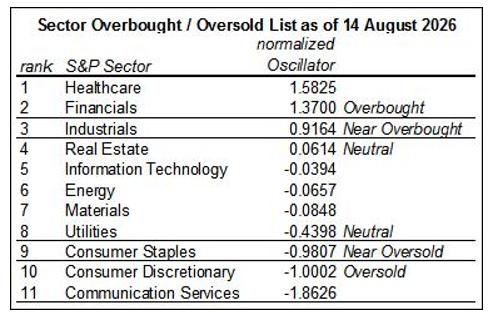
OBOS List: Healthcare And Financials Still Overbought, Industrials Near Overbought. Communication Services And Consumer Discretionary Oversold; Consumer Staples Near Oversold.
Healthcare and Financials were again overbought last week, while Industrials were near overbought. Communication Services and Consumer Discretionary were oversold once more, and Consumer Staples were near oversold. Extreme overbought and oversold conditions we witnessed over the past several weeks have been relieved by the market’s rotation.
Our tactical sector rotation model uses the S&P 500 GICS sector classifications. We apply a 13-week rate of change methodology that normalizes the rankings from overbought (OB) to oversold (OS). An industry group is overbought when it has risen too far too fast, relative to the rest of the market, based upon its normal movement. Conversely, it’s oversold when it has lost too much too fast, relative to the rest of the market, based upon its normal movement. Over time, a sector tends to move back toward its normal rate of change, relative to the rest of the market. Overbought sectors tend to slow their pace of gains in relative price, while oversold sectors tend to improve in relative price until they reach their average performance again.
Here’s our methodology: the overbought-oversold table of sectors measures the 13-week rate of change in the relative price of each sector. We then average (i.e., smooth) this over 3 weeks and normalize the results. Normalized oscillator values over 1.0 are considered overbought, while those between 0.6 and 1.0 are considered near overbought. Normalized oscillator values below -1.0 are considered oversold, while those between -0.6 and -1.0 are considered near oversold.
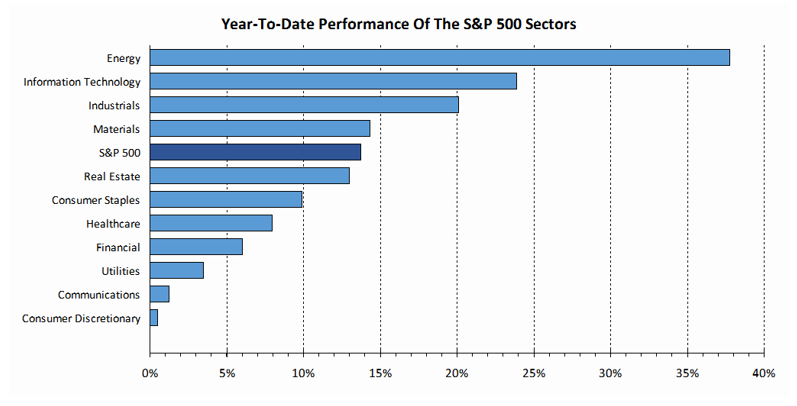
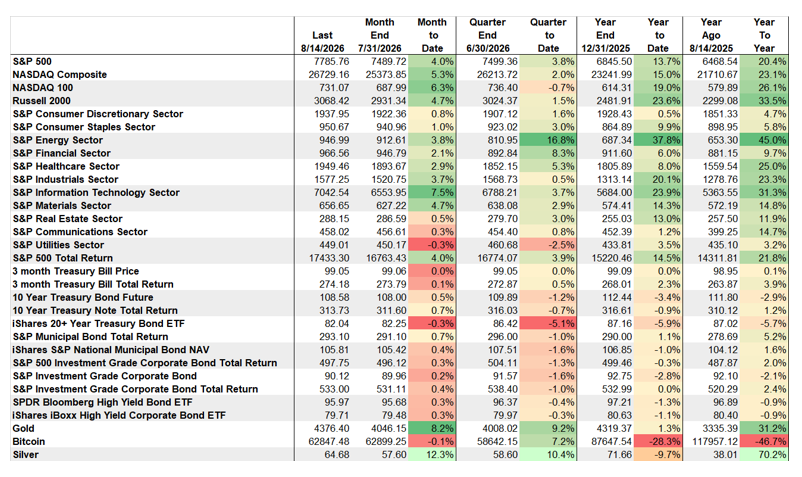
Market Performance: Energy Still The Best Performing Asset; Information Technology And Russell 2000 Follow Distantly. Bitcoin Remains Weakest.
Lazy Days of Summer? Not For Energetic Markets
This week’s economic data and Fed minutes should keep the summer uptrends buzzing along.
The most consequential economic release this week is likely the minutes from the FOMC’s July meeting, scheduled for Wednesday. The minutes should offer a clearer window into the internal debate — what Fed Chair Kevin Warsh called a “good family fight” — between officials who see a case for further rate hikes and those who prefer to hold steady amid signs of cooling inflation and softening labor- market data.
Tuesday’s industrial production and capacity utilization report will provide a timely read on the manufacturing side of the economy. Housing data will also be in focus, with building permits, housing starts, and pending home sales offering updates on residential activity. The balance of the calendar is dominated by regional manufacturing surveys (Empire State on Monday, Philadelphia Fed on Thursday) and other soft data that tend to move markets less dramatically than the hard numbers or the Fed minutes.
The Week's Calendar
MON
8:30 AMEmpire State Manufacturing Survey
10:00 AMNAHB Housing Market Index
TUE
8:30 AMHousing Starts
8:30 AMImport Prices
9:15 AMIndustrial Production
9:15 AMCapacity Utilization
10:00 AMPending Home Sales
EARNINGSHome Depot*
WED
2:00 PMFederal Open Market Committee meeting minutes published
THU
8:30 AMPhiladelphia Fed Business Outlook Survey
8:30 AMWeekly Jobless Claims
10:00 AMLeading Indicators
EARNINGSWalmart
FRI
9:45 AMUS Flash Manufacturing PMI
9:45 AMUS Flash Services PMI
* Earnings reflect highlights Sources: MarketWatch/Kiplinger's
