
Last night, it was announced that the United States and Iran reached an interim framework peace deal to end their four-month-long conflict. Equity markets around the world are celebrating with a strong rally.
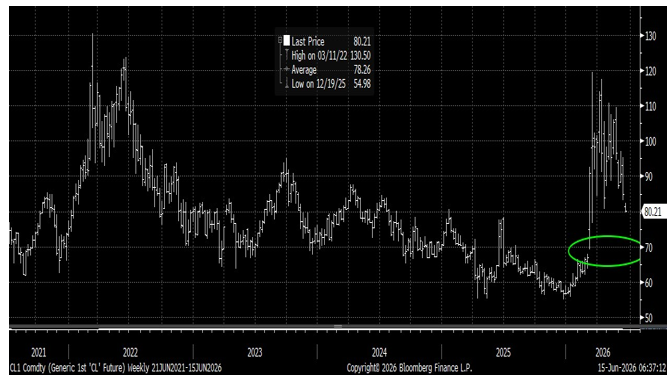
The agreement — brokered with the help of Pakistan, Qatar, and Saudi Arabia — aims to reopen the Strait of Hormuz, lift the U.S. naval blockade on Iranian ports, and establish a 60-day ceasefire to negotiate a final nuclear accord. This has allowed oil prices to fall sharply to $80. If the agreement holds and energy supplies normalize, oil prices could continue to trend lower in the months ahead, falling to the low $70s. This should ease inflation pressures and provide relief to the consumer with lower gasoline prices.
OIL PRICES FALLING SHARPLY, TARGETING THE LOW $70s
CPI & PPI: Hot Headline, Cooler Core
Last week, the May Consumer Price Index (CPI) and Producer Price Index (PPI) rose to multi-year highs, driven largely by higher energy costs. However, the core measures (excluding energy) came in softer than expected.
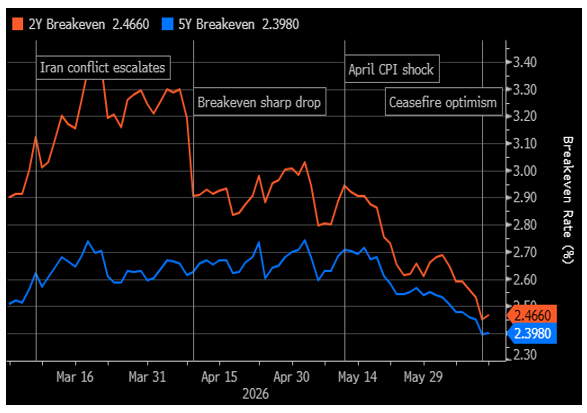
Markets responded favorably to the mixed data, scaling back expectations that the Federal Reserve will need to raise interest rates this year. Meanwhile, 2- and 5-year Treasury Inflation-Protected Securities (TIPS) breakeven rates — which measure inflation expectations — have retreated toward levels from before the start of the Iran conflict, suggesting bond investors view the recent inflation spike as temporary rather than persistent. That assessment helped support equity markets.
BREAKEVENS — THE TREASURY MARKET'S ESTIMATES OF INFLATION — ARE TAME
SpaceX Was the Highlight of Last Week
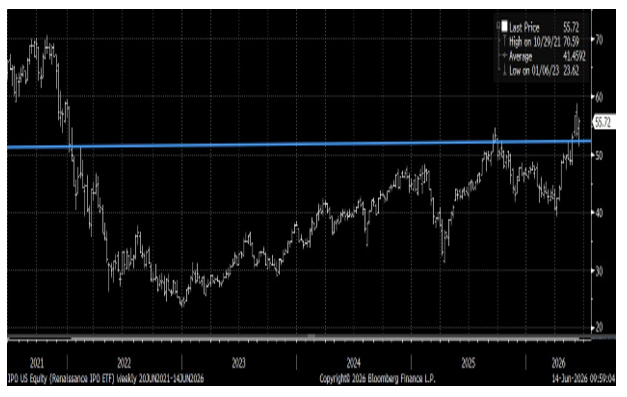
Last week's biggest story was the successful initial public offering (IPO) of SpaceX (SPCX). Shares gained nearly 20% from the $135 offering price, reflecting strong investor demand and helping to fuel broader market optimism. The transaction may also signal the beginning of a more active IPO environment. The Renaissance IPO ETF (IPO), a widely followed benchmark for newly public companies, recently broke out of a four-and-a-half-year trading range, suggesting improving sentiment toward growth-oriented new issues. Looking ahead, investors are also watching several high-profile private companies that could enter the public markets, including OpenAI and Anthropic.
RENAISSANCE IPO ETF (IPO) ATTEMPTING BREAKOUT
SpaceX to Enter Indexes at an Accelerated Pace
Normally, newly public companies must wait months — or even longer — before becoming eligible for index inclusion. For example, S&P Dow Jones Indices currently requires a 12-month seasoning period before a company can be added to the S&P 500. However, several index providers have implemented fast-track procedures for SpaceX's mega-cap IPO. Russell, MSCI, and Nasdaq have all indicated that SPCX could be added on an expedited basis. S&P Dow Jones has declined to waive its rules, meaning SPCX is unlikely to be added to any S&P index for at least 12 months.
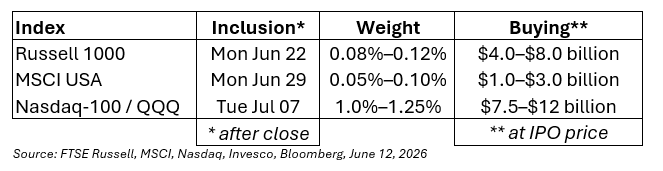
When a stock is added to a major index, ETFs and mutual funds that track that benchmark must purchase shares at the market, creating incremental demand. The table below shows the expected inclusion dates for each index (with inclusions occurring after the market close), the estimated index weighting for SPCX, and the potential dollar amount of demand based on the $135 IPO price. Note that the Juneteenth holiday will push all inclusion dates back by one trading day, while the July 4th holiday (observed Friday, July 3) is expected to delay the Nasdaq/QQQ inclusion by an additional day.
EXPECTED INDEX INCLUSION DATES, WEIGHTS & ESTIMATED BUYING
The Nasdaq-100 applies a special adjustment factor for low-float stocks such as SPCX, which could significantly increase its effective weight within the index. Because only 7%–8% of shares are expected to be publicly available initially, even modest index weightings could generate substantial buying pressure as passive funds accumulate shares regardless of price. The combination of limited float and forced index-related demand could contribute to elevated volatility in SPCX over the coming weeks.
Leveraged ETFs & Options Begin Trading on SpaceX
Several leveraged ETFs tied to SPCX are expected to launch. ProShares Ultra SpaceX (SPCF), Leverage Shares by Themes, and Direxion are launching various leveraged ETFs on SpaceX. These will provide additional liquidity and volatility to the stock. Options (puts and calls) on SPCX also will begin trading early this week — accelerated listing that should help market makers and institutional investors hedge positions more easily, another form of added liquidity.
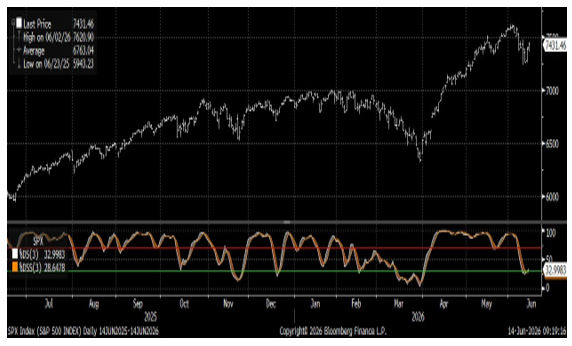
Equity Markets Are Oversold, Positioned to Rally
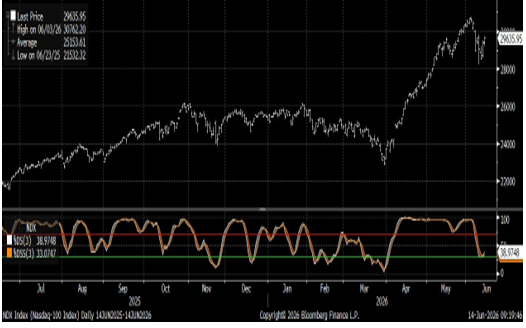
Summer is quickly approaching, and equity markets have historically tended to rally through the season before peaking and experiencing a correction during the September–October period. The current backdrop suggests that pattern may play out again this year. Both the S&P 500 and Nasdaq 100 are showing oversold readings on their 14-day stochastic indicators and are nearing potential buy signals, suggesting the market could have additional upside before seasonal weakness emerges later in the year. If the S&P 500 can break to new highs, the target range is 7800–7850, or a 5%–6% rally from Friday's close — an early welcome to summer.
S&P 500 WITH 14-DAY STOCHASTIC SHOWING AN OVERSOLD READING
NASDAQ 100 WITH 14-DAY STOCHASTIC NEAR AN OVERSOLD READING
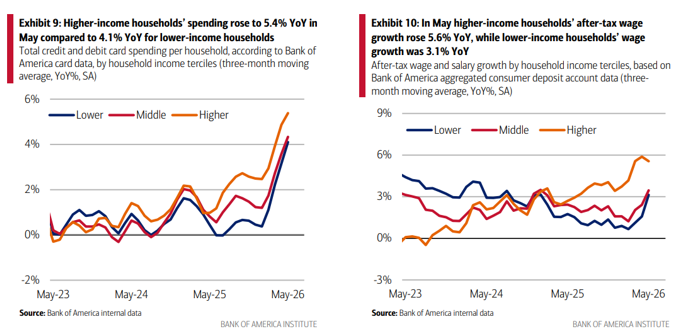
The Consumer Is Spending With Higher Wages
Bank of America deposit data for the month of May showed that consumers are increasing spending as wages are also improving. Spending year-over-year is up 5.4%, the highest level over the past four years. It's possible the World Cup may be contributing to increased spending, but rising wages remain the more important driver of consumer demand.
SPENDING ROSE 5.4% YoY FOR HIGHER-INCOME HOUSEHOLDS; WAGES UP 5.6% YoY
The AI Infrastructure Buildout Compares to the Railroads & Electricity
Investment in AI infrastructure is expected to approach $1.0 trillion this year and an additional $1.0 trillion next year. The last time the United States experienced a buildout of this magnitude was during the expansion of the railroad network, which transformed commerce, transportation, and economic growth. In terms of its potential impact on daily life, however, AI may be more comparable to the adoption of electricity — touching nearly every industry, business, and household, and fundamentally changing how we live and work. Put simply, this may prove to be the most significant technological transformation of our lifetime.
The AI story is evolving as the industry begins to confront the physical limits of scaling. Attention is increasingly turning to the infrastructure that powers AI — including the transition from copper to optical interconnects, growing demand for advanced memory, and the challenge of securing sufficient power to support next-generation data centers.
Copper-to-Optical Interconnects
AI data centers are switching to optical because copper cables cannot carry the enormous data volumes at the speeds and distances required as GPU clusters expand. For next-generation systems like Nvidia's (NVDA) Vera Rubin, copper's practical limit is roughly 1 meter before signal loss, heat, and power use become prohibitive. Optical (light-based) links solve this for longer intra-rack and rack-to-rack connections. Leaders include Broadcom (AVGO), Coherent (COHR), and Lumentum (LITE), with Corning (GLW) another beneficiary. Steady adoption is expected throughout the remainder of the decade.
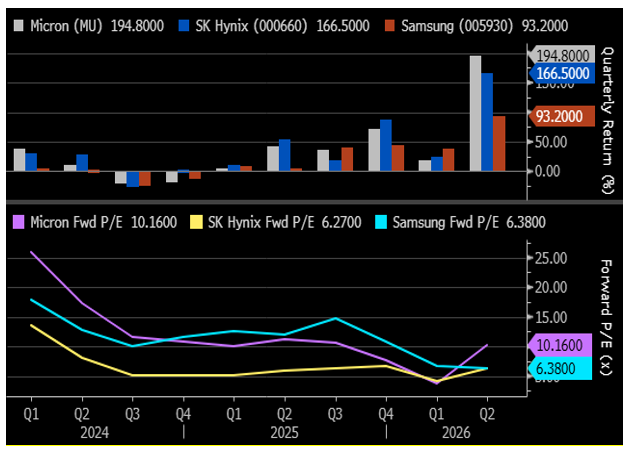
Memory Shortage
High Bandwidth Memory (HBM) for AI GPUs is in a long-running structural shortage. Memory chips are essential in almost everything — phones, cars, appliances, industrial machines — but AI demand far exceeds what manufacturers can supply. SK Hynix, Samsung, and Micron (MU) are sold out for 2026, and new plants take 2–3 years to build. Relief is not expected until late 2027–2028. Charting the performance and valuation of these three stocks reveals something unusual: valuations improved even as the stocks soared, because earnings are expanding at a rapid rate.
MEMORY CHIP MANUFACTURERS' VALUATIONS IMPROVED AS STOCK PRICES ROSE
Power Constraints
Training and running large AI models requires enormous electricity — entire data centers can consume hundreds of megawatts. Newer chips like Nvidia's Rubin and Blackwell are more efficient than the earlier H100 generation, but overall demand still outstrips supply, pushing chip prices higher. Nvidia last week raised the price of its Blackwell chip to $13,250 from $8,000–$8,565, a 66% increase. Higher product pricing often results in higher revenue and earnings — the "Inflation Boost" phase we have been describing, where higher inflation benefits the companies, stocks, and the economy.
Data centers can be built in 2–3 years, but new power plants take far longer to permit and build. Hyperscalers are increasingly building their own on-site ("behind-the-meter") natural gas-fired plants, exploring small modular nuclear reactors (SMRs), and restarting or extending existing nuclear and coal plants. Transformers — which step high-voltage transmission power down to usable levels — remain in shortage, with lead times of 2–4+ years. Power is now one of the tightest constraints on AI growth through 2028–2030.
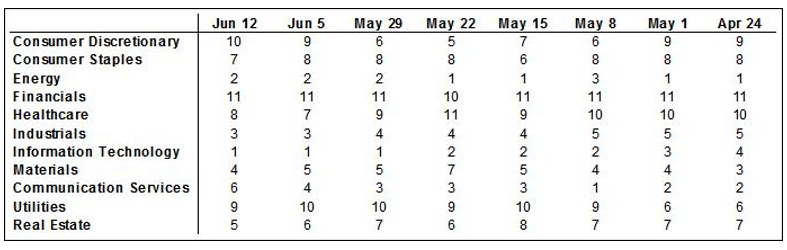
Sector Readings: Information Technology Remains Strongest; Financials Remain Weakest
Information Technology is still in first place, followed by Energy and Industrials — the same top three as last week. Financials are still in last place, followed by Consumer Discretionary, then Utilities. Energy has been among the top three sectors for 27 weeks, more than half a year, while Financials have been one of the two weakest sectors for 18 weeks, more than a quarter.
Our sector model analyzes S&P 500 GICS sector classifications, using a weighted measure of price momentum across three time periods. We rank each sector from 1 to 11 based upon the average of its 40-, 26-, and 13-week relative price performances, with 1 being the strongest and 11 the weakest.
SECTOR RANKINGS BY 40-, 26-, AND 13-WEEK AVERAGE RELATIVE PRICE PERFORMANCE
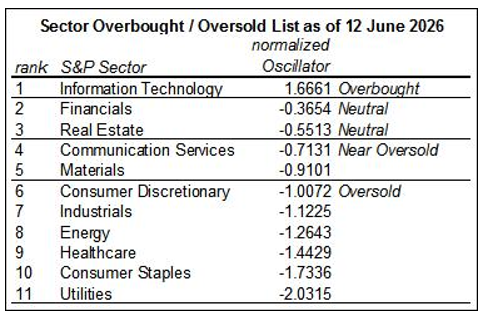
OBOS List: Information Technology Remains Overbought
Information Technology remained overbought last week. Utilities, Consumer Staples, Healthcare, Energy, Industrials, and Consumer Discretionary were all oversold, while Materials and Communication Services were near oversold. There is considerable potential for more volatility in the movement of sectors relative to one another, and an extraordinary number of sectors remain oversold. Conditions for a major sector rotation — and its associated volatility — are still in place.
Our methodology: the overbought–oversold table measures the 13-week rate of change in the relative price of each sector, averaged over 3 weeks and normalized. Normalized oscillator values over 1.0 are considered overbought (0.6 to 1.0 near overbought); values below −1.0 are oversold (−0.6 to −1.0 near oversold). Over time, a sector tends to move back toward its normal rate of change relative to the rest of the market.
SECTOR OVERBOUGHT / OVERSOLD LIST AS OF JUNE 12, 2026
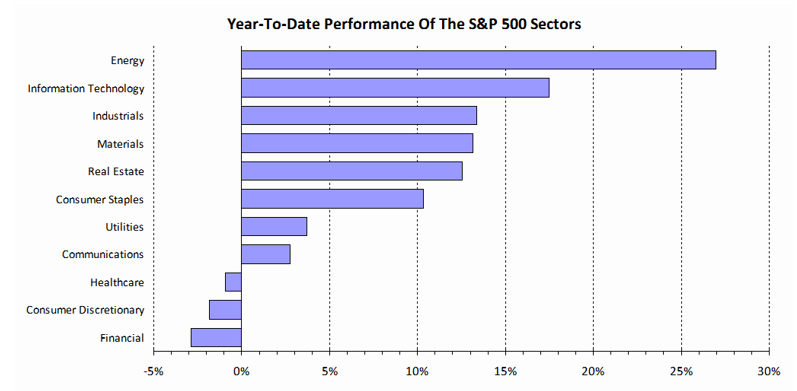
YEAR-TO-DATE PERFORMANCE OF THE S&P 500 SECTORS
Looking Ahead: A Big Week With a New Fed Chair
This is an important week for the Federal Reserve as new Chair Kevin Warsh presides over his first Federal Open Market Committee (FOMC) meeting. The FOMC meets June 16–17, with its policy decision scheduled for Wednesday afternoon. While no change in interest rates is expected, investors will be focused on Warsh's first press conference for clues regarding the Fed's policy outlook, updated dot plot projections, and views on inflation.
The meeting comes against a rapidly changing geopolitical backdrop. The newly announced U.S.–Iran framework agreement has already pushed oil prices sharply lower, raising the possibility that energy-driven inflation pressures could ease more quickly than previously expected. The Juneteenth market holiday on Friday, June 19, shifts quarterly futures and options expiration to Thursday, June 18, while also affecting the timing of certain SpaceX-related index flows and options activity. The combination of these events could contribute to elevated market volatility during the week.
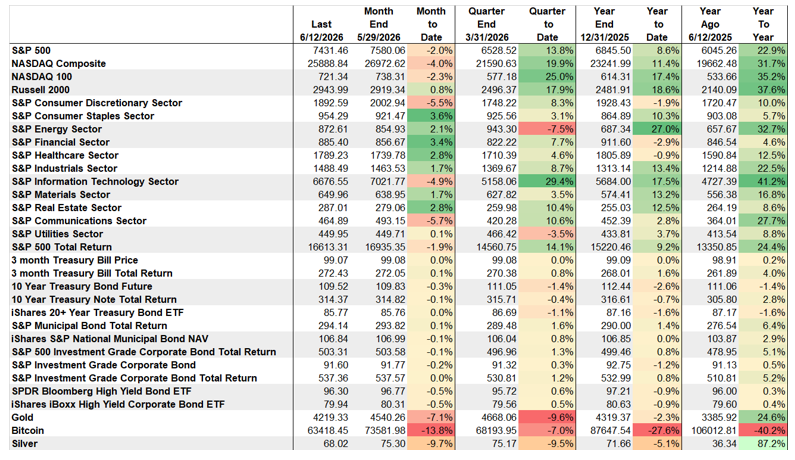
MARKET PERFORMANCE: ENERGY STILL THE BEST PERFORMING ASSET YEAR-TO-DATE; BITCOIN THE WEAKEST
The Week's Calendar
MON
8:30 AMEmpire State Manufacturing Survey
9:15 AMIndustrial Production, M/M%
9:15 AMCapacity Utilization %
10:00 AMNAHB Housing Market Index
TUE
8:30 AMHousing Starts
8:30 AMImport Prices
EARNINGSJabil
WED
8:30 AMRetail Sales
10:00 AMManufacturing & Trade Inventories & Sales
10:00 AMPending Home Sales, M/M%
2:00 PMU.S. Interest Rate Decision
THU
8:30 AMWeekly Jobless Claims
8:30 AMPhiladelphia Fed Business Outlook Survey
10:00 AMLeading Indicators
FRI
Markets closed in observance of Juneteenth. No events scheduled.
