
This is a holiday week with the markets closed on Friday in observance of the Fourth of July. Equity markets are biased to rally into a long holiday weekend. As we enter July, the Dow Jones Industrial Average (DJIA) and the Russell 2000 small cap index both reached record highs last week. The S&P 500 and Nasdaq 100 have been consolidating and approaching oversold readings. Historically, the S&P 500 has tended to rally into July before entering a more volatile period. August is often choppy, while September and early October have historically been among the market's weakest months. Those seasonal pullbacks have frequently created attractive buying opportunities ahead of a year-end rally. The S&P 500 has struggled recently in the 7,500-7,600 range and is currently trading at 7,354. We believe the market will attempt to rally to test the recent highs. We have maintained our year-end target of 7,500 as we do believe we can have a deep correction into the fall months. We maintain our longer-term secular bull market target range for the S&P 500 of 10,000-13,000.
Warsh, Bessent, And The Bond Market’s Vote Of Confidence On Inflation
Federal Reserve (Fed) Chair Kevin Warsh and Treasury Secretary Scott Bessent delivered closely coordinated messages last week on the importance of stabilizing inflation. Bessent publicly expressed confidence that Warsh will “optimize the path for both inflation and economic growth,” while praising the Fed’s decision to reduce forward guidance. Professional investors noted this alignment between monetary and fiscal leadership as a positive development for market stability.
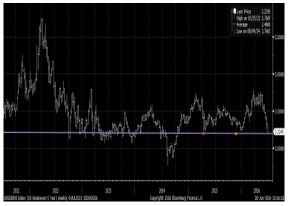
Five-year Treasury breakeven yields— a market-based measure of expected inflation over the next five years — have collapsed to 2.22%, signaling the market believes inflation should fall in the future toward 2%. This move indicates that bond investors are not overly concerned about inflation reaccelerating.
5-Year Breakeven Yields Collapse, Signaling Inflation Expectations Falling
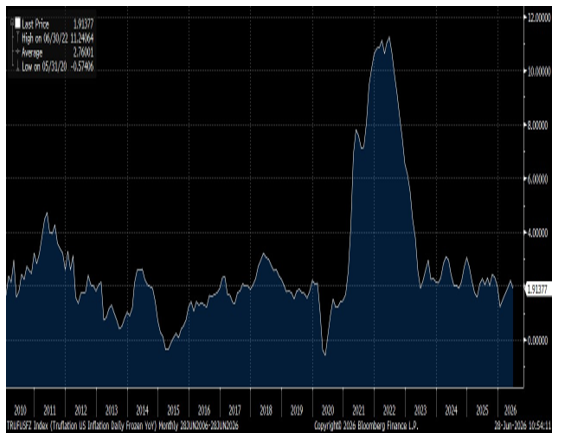
Secretary Bessent has previously highlighted Truflation, an alternative, real-time inflation gauge that draws on a broad range of consumer price data. The Truflation index currently sits at 1.9% year-over-year, reinforcing the market’s view that inflation pressures are easing. We also anticipate that Fed Chair Kevin Warsh may place greater emphasis on a broader range of inflation measures rather than relying primarily on the Core Personal Consumption Expenditures (PCE) Price Index.
The market is currently expecting the Fed to begin raising interest rates by the end of the year. We believe the surprise this year could be that sharply lower oil prices – combined with a shift in how inflation is measured – lead to the Fed cutting interest rates by year-end.
Truflation, Bessent’s Alternative Inflation Measure, Indicates Little Inflation Pressure
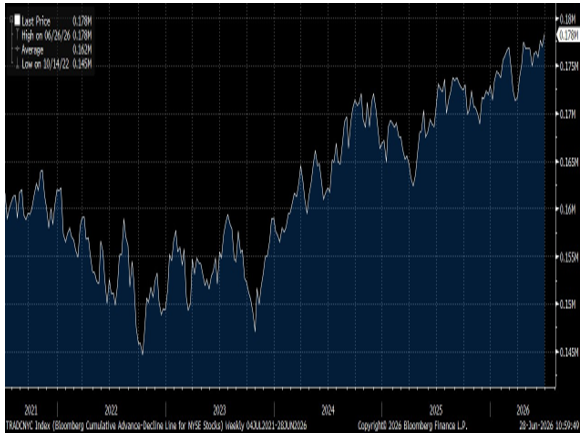
Market Breadth Reaches Record High, Confirming Bull Trend
Last week, despite the volatility, particularly in Technology, the Bloomberg cumulative advance-decline (A-D) line reached an all-time high. The S&P 500 A-D line also hit a record high. This confirms the equity market remains in a bull market with new highs achievable.
Bloomberg Cumulative Advance-Decline Line Posts Record High
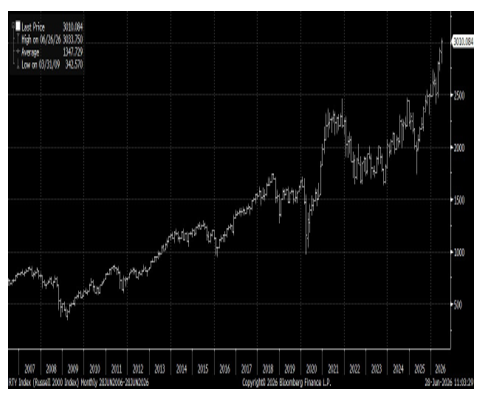
Small Caps Hit All-Time High
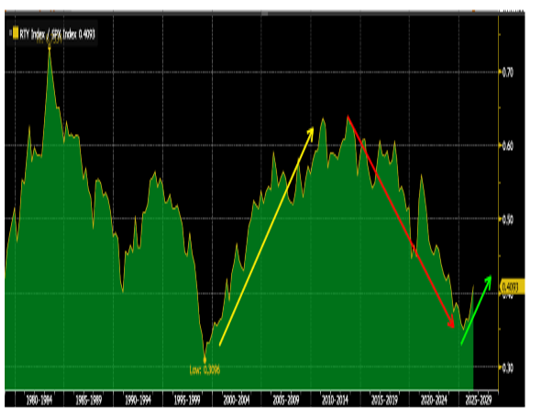
The Russell 2000 small cap index hit an all-time high and is outperforming the large cap stocks so far this year. The S&P 500 is up 7% with the Russell 2000 up 21%. The relative price has made an important bottom, in our view, similar to the low in 1999. We believe small caps are in the early phases of entering a secular trend of outperforming. We would continue to diversify portfolios toward smaller cap stocks.
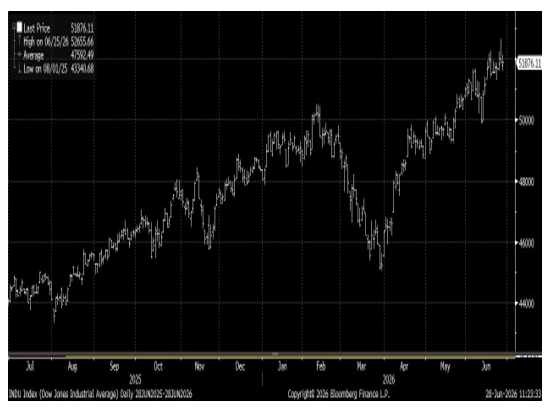
The Dow Jones Industrial Average (DJIA) also hit an all-time high last week. Today (Monday), Google parent company Alphabet (GOOGL) will be added to the DJIA, replacing Verizon (VZ). Alphabet will be the Dow’s fifth Magnificent 7 member.
Russell 2000 Small Cap Index At Record High
Russell 2000 Relative To S&P 500: Small Caps In Early Cycle Of Outperforming
Dow Jones Industrial Average Hits Record High
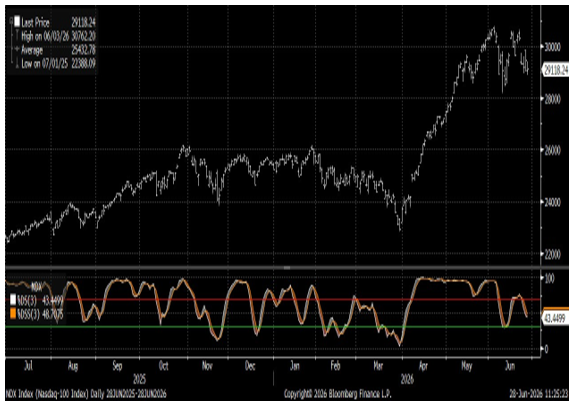
Nasdaq 100 With 14-Day Stochastic Correcting
Debasement Trade Not Here
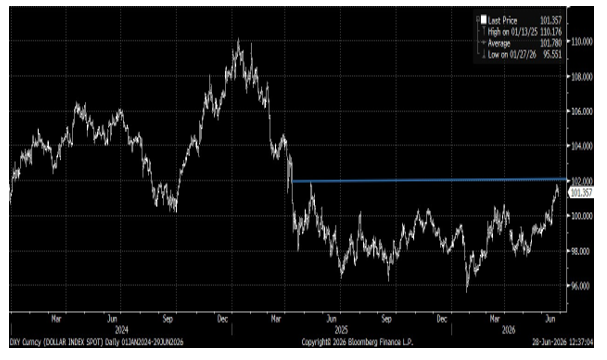
Many investors have been calling for the demise of the U.S. dollar, but last week the U.S. dollar began a rally as the market is expecting the Fed to begin raising interest rates. Should the dollar index break above 102, investors should expect a stronger rally in the dollar, in our view.
U.S. Dollar Rallying On Higher Rate Expectations
Risk Of Higher Rates & Stronger Dollar Put Pressure On Precious Metals
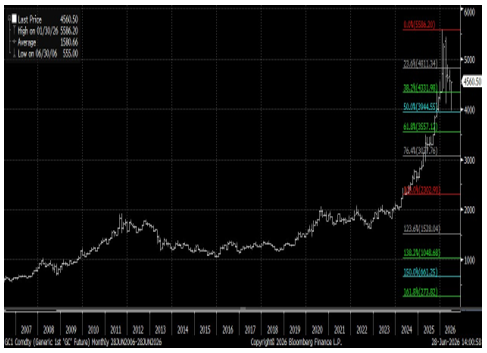
Higher interest rates, growing expectations that the Fed could resume raising rates, and a stronger U.S. dollar have put pressure on precious metals. Gold has been correcting since a peak of $5,586. It is traditional for a strong rally to correct one-third to one-half of a move. Gold has support near the 50% retracement level at $3,945. Amid elevated uncertainty, we expect Gold to remain in a choppy trading range, with good support near $4,000. Should this level not hold, the risk is a 61.8% correction near $3557. We maintain the long-term projection for Gold is $10,000.
Gold With Fibonacci Levels: Support $4,000–$3,800
Silver Testing Major Breakout Support Level
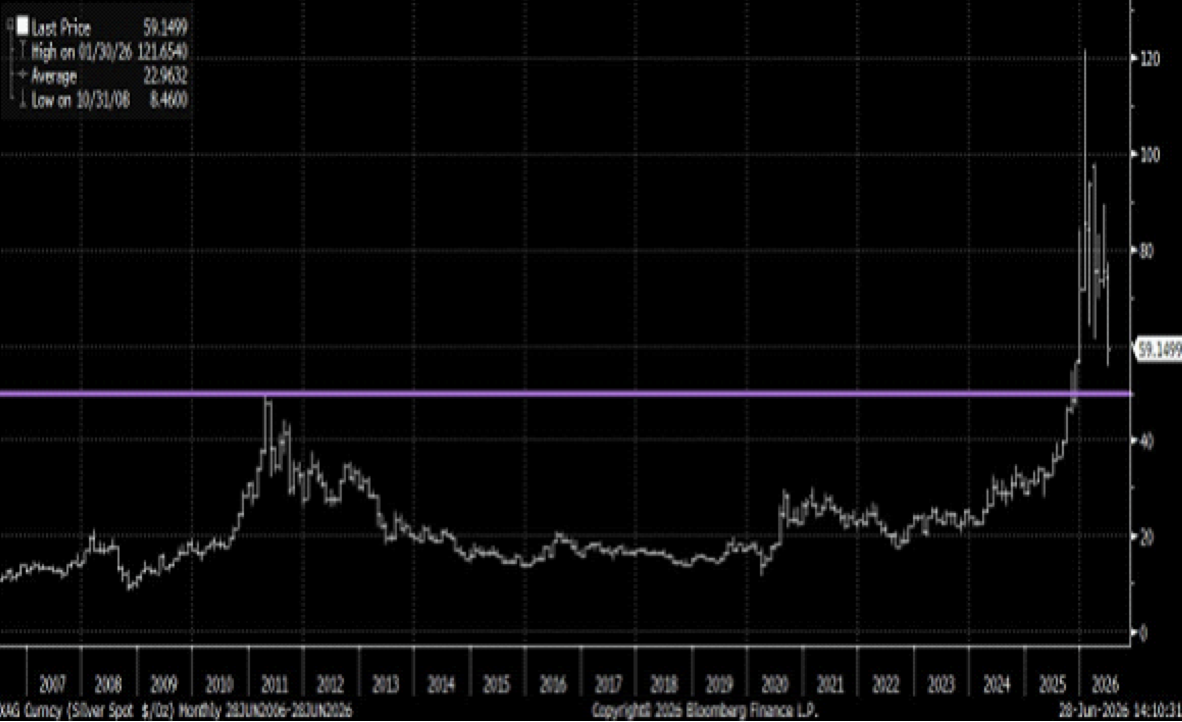
Silver broke out from a nearly 45-year base and we believe Silver is now testing that breakout near $50. We believe the long-term potential is for Silver to trade toward $200.
Silver Spot Price Testing 45 Year Major Breakout Level
What Are The Risks?
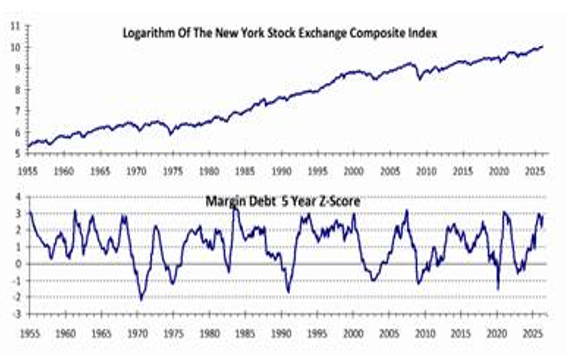
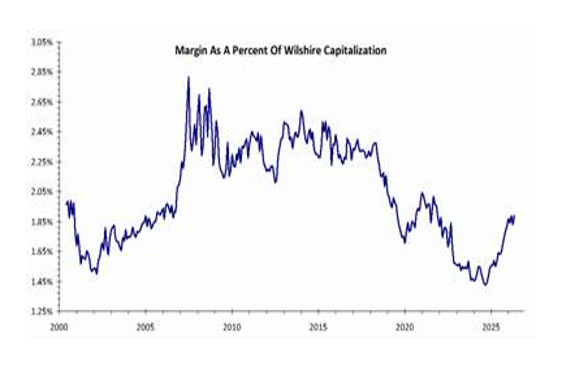
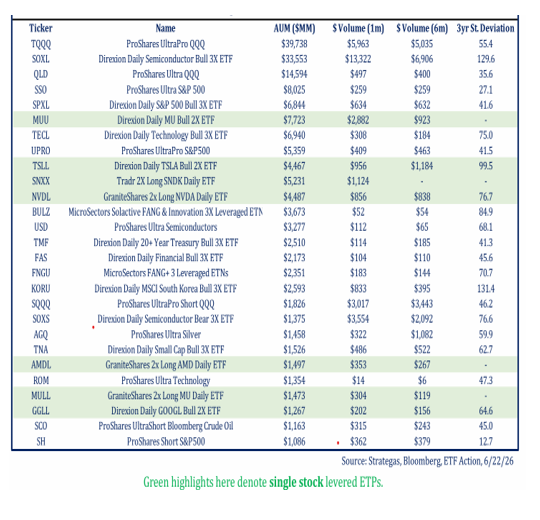
Risk 1: Leverage Is High In Margin Debt & Leveraged ETFs
There are always risks in the market. Today, the greatest concern we see is the buildup of leverage and margin debt, particularly within the Technology sector. Leverage has risen sharply relative to total market capitalization, as measured by the Wilshire 5000 Index. If we do get a correction in the fall months, it may be a deeper correction of 10%-15% as investors would be forced to deleverage positions. We expect this to cause volatility but not end the bull market rally.
Top ETFs With Leverage
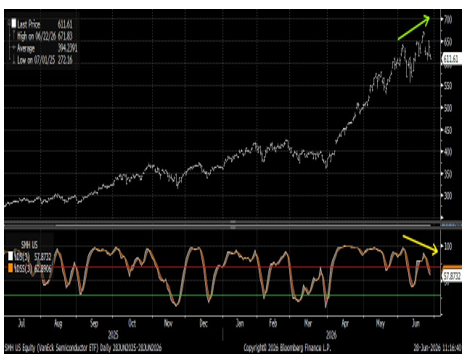
Risk 2: Semiconductors Rallying But Price Momentum is Weakening
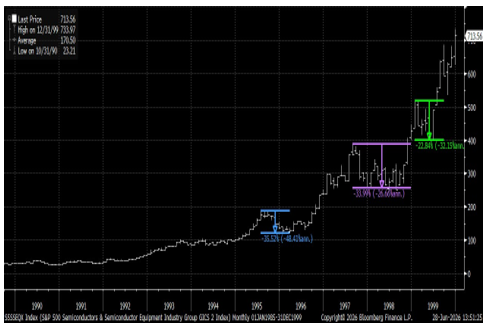
The VanEck Semiconductor ETF (SMH) is exhibiting a negative divergence, with prices continuing to advance while momentum has begun to weaken. This could be signaling a potential correction coming in semis. Since there is leverage built into this sector, it could be a significant correction of 30%. We expect semis to maintain leadership. We do not believe this is a bubble that is popping. Looking back to the 1990s, the semi stocks have had several bear market corrections (30%+) before peaking. With AI infrastructure and data center development still in the early stages, we do not believe the semiconductor cycle has yet reached its peak or the point at which semiconductor demand becomes commoditized.
VanEck Semiconductor ETF With Negative Price Momentum
S&P Semi Stocks During 1990s
Semi Fundamentals Remain Positive Longer-Term
Strong Cash Flows, Rising Orders, And Tight Supply
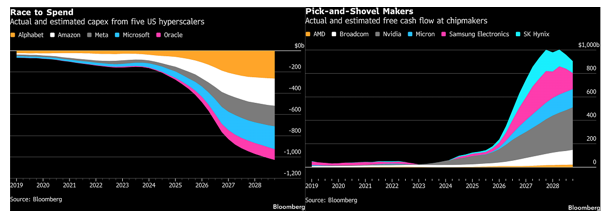
Semiconductor companies are generating record free cash flow while investing heavily for future growth. Industry-wide projections show chip makers on track to produce roughly $1.0 trillion in cumulative free cash flow by 2027. At the same time, the major hyperscalers (such as Microsoft, Amazon, Alphabet, and Meta, all building massive AI data centers) are expected to spend close to $1.0 trillion on capital expenditures in 2027. The accompanying chart of hyperscaler spending versus chip-maker free cash flow shows nearly mirror-image ramps, a powerful visual of how supply and demand are aligned for strong multi-year growth in the AI infrastructure buildout. Because current production capacity still cannot meet surging demand, unfilled orders continue to rise, pushing prices for key memory chips higher.
CapEx By Hyperscalers Becomes Cash Flow For Chip Makers
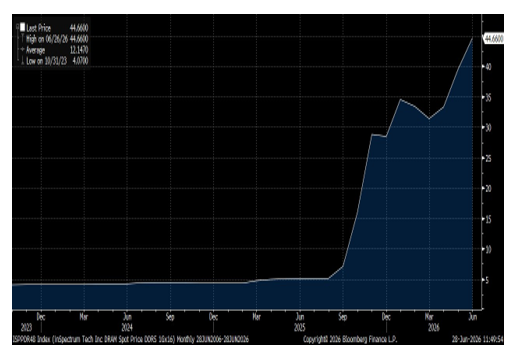
Shortage Of Memory For Chips Has Caused DRAM Prices To Surge
Memory chip makers such as Micron (MU) have seen their stock rise sharply on the shortage of enough memory to meet demand. This has resulted in DRAM (Dynamic Random-Access Memory) prices skyrocketing. This has also caused some technology companies such as Apple (AAPL) and Microsoft (MSFT) to raise prices on their products.
DRAM Spot Pricing Has Skyrocketed On Shortages
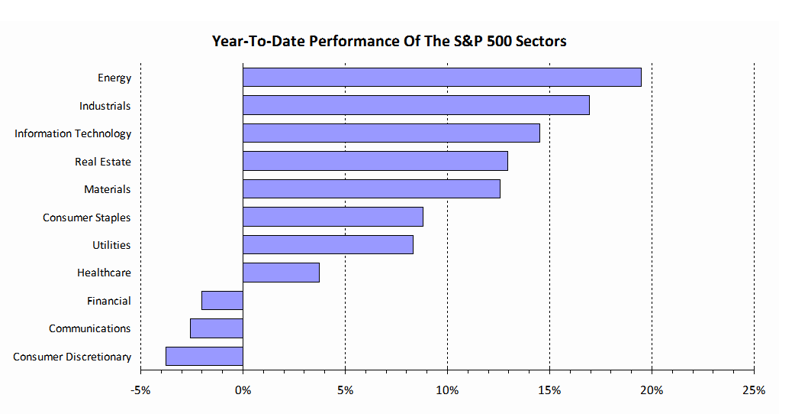
Sector Readings: Information Technology Remains In First Place, Followed By Industrials, Then Energy; Consumer Discretionary In Last Place, Followed By Communication Services
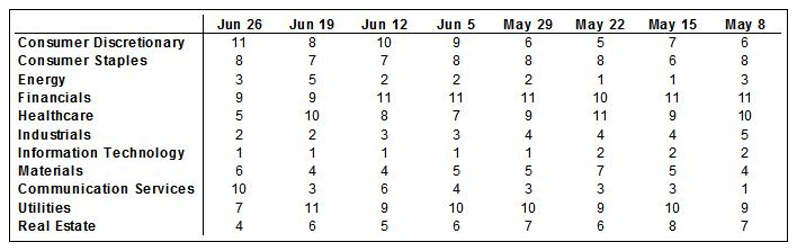
Information Technology is still strongest, followed by Industrials, then Energy. Consumer Discretionary is in last place, followed by Communication Services. Energy returned to the top three sectors, where except for last week, it has been for 30 weeks. The decline in Communication Services is dramatic.
Our sector model analyzes S&P 500 GICS sector classifications, using a weighted measure of price momentum across three time periods. We rank each sector from best to worst based upon the average of its 40-, 26-, and 13-week relative price performances. We rank each sector from 1 to 11, with 1 being the strongest and 11 the weakest.
Sector Rankings By 40-, 26-, And 13-Week Average Relative Price Performance
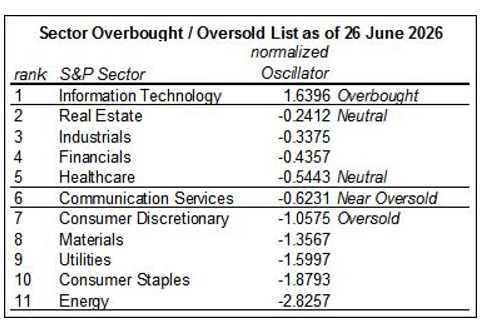
OBOS List: Information Technology Is Still Overbought; Energy, Consumer Staples, Utilities, Materials, And Consumer Discretionary Are Oversold; Communication Services Is Near Oversold.
Information Technology was still overbought last week. Energy is significantly oversold followed by Consumer Staples, Utilities, Materials, and Consumer Discretionary also being oversold; Communication Services was near oversold. The extreme overbought/oversold situation we saw two weeks ago has been somewhat relieved, but not completely. Conditions for a major sector rotation and its associated volatility remain.
Our tactical sector rotation model uses the S&P 500 GICS sector classifications. We apply a 13-week rate of change methodology that normalizes the rankings from overbought (OB) to oversold (OS). An industry group is overbought when it has risen too far too fast, relative to the rest of the market, based upon its normal movement. Conversely, it’s oversold when it has lost too much too fast, relative to the rest of the market, based upon its normal movement. Over time, a sector tends to move back toward its normal rate of change, relative to the rest of the market. Overbought sectors tend to slow their pace of gains in relative price, while oversold sectors tend to improve in relative price until they reach their average performance again.
Here’s our methodology: the overbought-oversold table of sectors measures the 13-week rate of change in the relative price of each sector. We then average (i.e., smooth) this over 3 weeks and normalize the results. Normalized oscillator values over 1.0 are considered overbought, while those between 0.6 and 1.0 are considered near overbought. Normalized oscillator values below -1.0 are considered oversold, while those between -0.6 and -1.0 are considered near oversold.
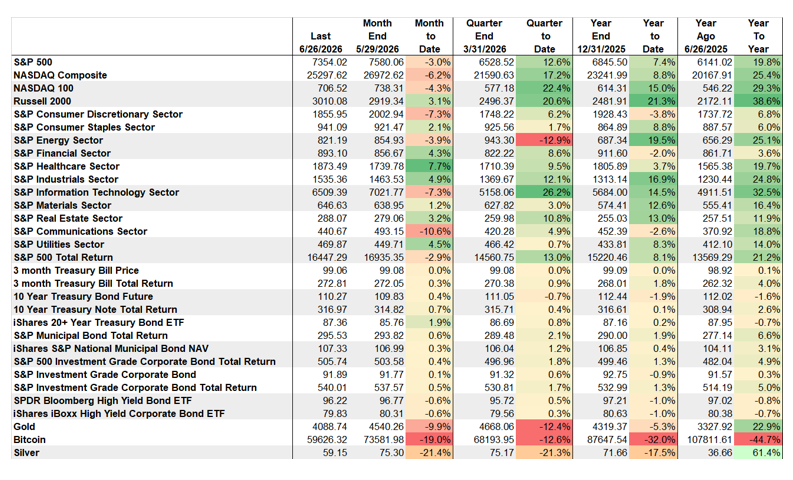
Market Performance: Russell 2000 Was The Best Performing Asset Year-To-Date, Followed By Energy; Bitcoin Is Weakest By Far
Stars, Stripes, And Jobs
This week investors will look at jobs within our borders and geopolitics outside them.
As America prepares to celebrate its 250th birthday, investors will be closely watching this week's labor market data, including JOLTS job openings, the ADP employment report, and Thursday's June nonfarm payrolls report. The employment data will be scrutinized for signs of labor market strength, wage growth, and unemployment as investors assess whether Fed Chair Kevin Warsh is likely to maintain a higher- for-longer interest rate policy.
Markets will also monitor developments in the Strait of Hormuz to gauge whether the U.S.-Iran ceasefire can hold. Early in the week, attention will focus on housing data, including the S&P/Case-Shiller Home Price Index, along with Conference Board consumer confidence and manufacturing activity.
Trading hours will be shortened on Thursday, July 2 (equities close at 1:00 p.m. ET), with full market closure on Friday, July 3, for the Independence Day holiday. As a result, labor market conditions, consumer confidence, and geopolitical developments are likely to remain the dominant themes heading into the long holiday weekend.
Happy & Safe 4th to All.
The Week's Calendar
MON
No events scheduled
TUE
9:00 AMS&P Cotality Case-Shiller Home Px Index
9:45 AMChicago Business Barometer - ISM-Chicago Business Survey - Chicago PMI
10:00 AMConference Bd - Consumer Confidence
10:00 AMJob Openings & Labor Turnover Survey
EARNINGSNike*
WED
8:15 AMADP National Employment Report
9:45 AMUS Manufacturing PMI
10:00 AMISM Report On Business Manufacturing PMI
10:00 AMConstruction Spending
EARNINGSMicron Technology
THU
8:30 AMWeekly Jobless Claims
8:30 AMEmployment Report
8:30 AMUnemployment Rate
8:30 AMAvg Hourly Earnings, M/M%
8:30 AMAvg Hourly Earnings, Y/Y%
10:00 AMFactory Orders
FRI
No events scheduled
The stock and bond markets in the U.S. are closed on Friday, July 3, to observe the Fourth of
July holiday.
* Earnings reflect highlights Sources: MarketWatch/Kiplinger's
