

Federal Reserve (Fed) Chair Kevin Warsh said the Committee remains fully committed to its 2% inflation goal and will not accept a higher target. He noted that, since the last FOMC meeting, markets have already tightened financial conditions on their own and that business investment, especially in technology, remains strong. For investors, the message is that the Fed is in no hurry to make a move but is watching inflation closely, leaving open the possibility of raising rates later if inflation does not cool further.
Reporters Play Hard Ball With Fed Chair On Interest Rates
Seven of the nine reporters who posed questions to Fed Chair Warsh after the latest policy meeting took an unusually confrontational approach. They repeatedly asked why rates were raised immediately, challenged the decision to hold rates steady, and showed far less deference than is customary for a Fed chair. (Yes, new Fed Chairs are always tested, but this seemed especially strident.) Even the more measured questions from Nick Timiraos of The Wall Street Journal and Brian Chung of NBC carried a sharper edge to their questions than usual. In response, Warsh noted that he has held the job for only 8½ weeks while inflation has run above the Fed’s 2% target for more than five years. The exchange leaves investors with a clear signal that media scrutiny of the new leadership will remain intense and that markets will continue to parse every word for clues about future policy moves.
Imports And Lower Government Spending Held Back Second-Quarter Growth
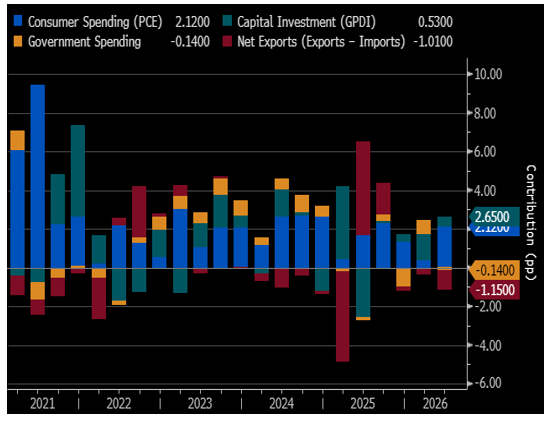
Second-quarter economic growth came in softer than most analysts expected. The official measure of total U.S. output, Gross Domestic Product (GDP), rose at only a 1.5% annual rate, lower than the expected 1.8%. Consumer spending stayed solid and continued to support the economy. The weaker headline number was caused mainly by a larger-than-expected jump in imports and a small drop in government spending. Imports are subtracted from the GDP calculation, and they surged, which pulled the overall growth rate lower — even though American households kept spending.
For investors, the important takeaway is that domestic demand remains healthy. The soft GDP number does not signal a sudden drop in business or household activity. It does, however, keep the Fed cautious about raising interest rates too quickly.
Imports And Reduced Government Spending Lowered Q2 GDP
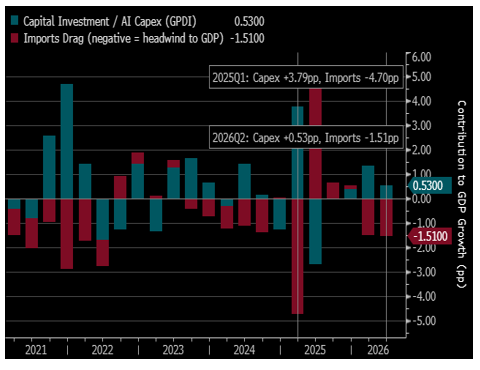
AI Investment Rose, but Imports of Technology Equipment Offset Much of the Gain
Companies spent heavily on artificial intelligence (AI) equipment and data center capacity in recent quarters. That capital investment normally adds to economic growth. At the same time, a large share of the servers, chips, and related gear was imported. Imports reduce the GDP total, so the investment boost and the import drag largely canceled each other out. In one recent quarter, the two forces were almost equal in size.
This pattern matters for stock investors. Strong AI capital spending is real and supports technology and semiconductor companies. Yet because so much of the equipment comes from abroad, the spending has not lifted overall U.S. growth as much as the investment headlines suggest. The market may continue to reward companies that successfully convert that spending into higher profits while remaining sensitive to any slowdown in the import-heavy build-out of the AI infrastructure.
AI Capex Vs. Import Drag - GDP Contributions In Percentage Points
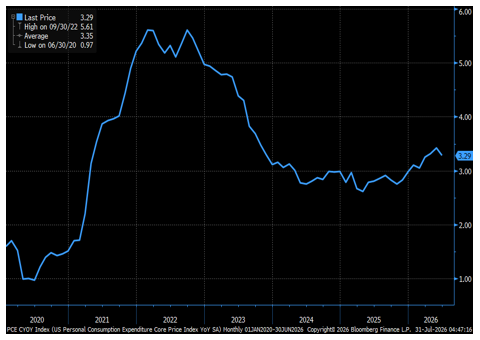
Core Consumer Prices Stayed In Line With Expectations While Broader Inflation Pressures Reappeared
The Fed’s preferred inflation gauge, the core Personal Consumption Expenditures (PCE) price index, continued to match what economists had forecast and showed further cooling in June. That softer reading gave the Fed room to leave interest rates unchanged. In contrast, the broader GDP price index, which covers all goods and services produced in the United States, accelerated to a 6.2% annual rate in the second quarter.
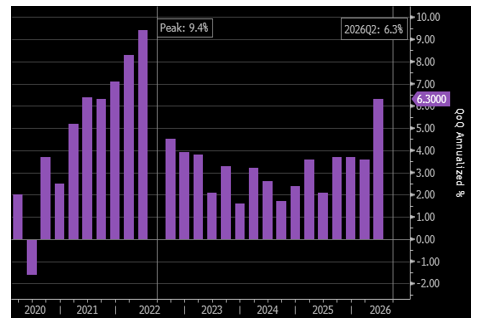
Two forces drove the higher GDP inflation number. Energy prices rose sharply because of the ongoing conflict with Iran and related disruptions in shipping. Plus, the large volume of imported AI components reduced real GDP and, by simple arithmetic, pushed the price index higher.
Investors should note the difference. Cooling consumer inflation is welcome and supports the case for a steady policy on interest rates. The jump in the broader GDP deflator, however, shows that energy and supply-chain pressures have not disappeared. That combination leaves markets sensitive to any further rise in oil prices or signs that inflation is broadening again.
Personal Consumption Expenditure Core Price Index (Core PCE) Year-To-Year
Though Core PCE Cooled, GDP Deflator Rebounded
The GDP deflator measures price changes across the whole economy and is shown as a quarterly figure at an annual rate. It peaked at 9.4% in 2022, cooled for several years, then rose to 6.2% in the second quarter of 2026. The increase came mainly from higher energy costs linked to the Iran conflict and from a surge in AI-related imports that lowered measured real GDP and therefore pushed the deflator higher. Core PCE inflation, the Fed’s preferred consumer gauge, cooled and stayed well below its earlier peak, supporting steady policy on interest rates. The higher GDP deflator shows that energy and supply pressures remain, leaving markets sensitive to further increases in oil or import costs.
This rebound is why the hawks on the FOMC want to raise rates.
US GDP Price Deflator: Quarterly Change At An Annual Rate (2020–2026Q2)
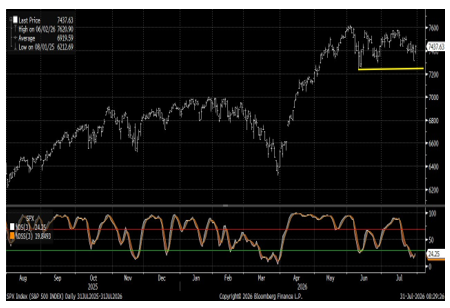
S&P 500 Oversold & Holding Support
The S&P 500 has had a 5% correction off its high, creating an oversold reading. The index is holding key support levels. It will be important for the S&P 500 to respond to this oversold reading and rally — or the risk will be another leg down in the pullback.
S&P 500 With 14-Day Stochastic With Oversold Reading
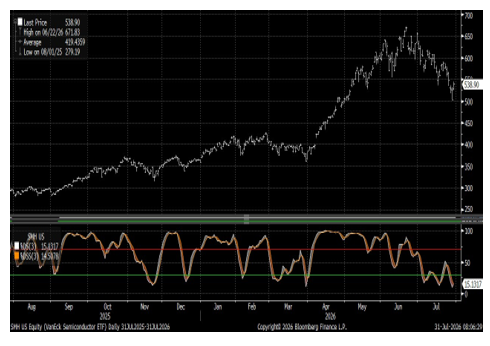
Semiconductors Oversold After 25% Correction
The VanEck Semiconductor ETF (SMH) has corrected by 25%, creating an oversold condition. It will be important for the ETF to respond to the oversold reading — or the risk will be additional downside. In the 1990s Dot-Com period, semiconductors had several periods of deep corrections in the range of 30%-50% and resumed the uptrend. We view the current period as a correction within an ongoing bull market trend. Semiconductors are the leaders of this secular bull market.
VanEck Semiconductor ETF (SMH) With 14-Day Stochastic
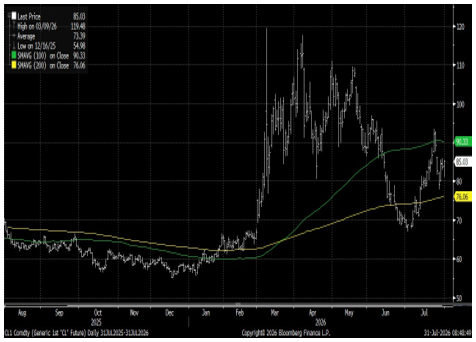
WTI Crude Oil Prices Look To Remain Elevated
WTI crude oil prices are range bound between the 100-day moving average at $90 and the 200-day moving average at $76, indicating oil prices look to remain elevated.
WTI Crude Oil Range Bound Between $90-$76
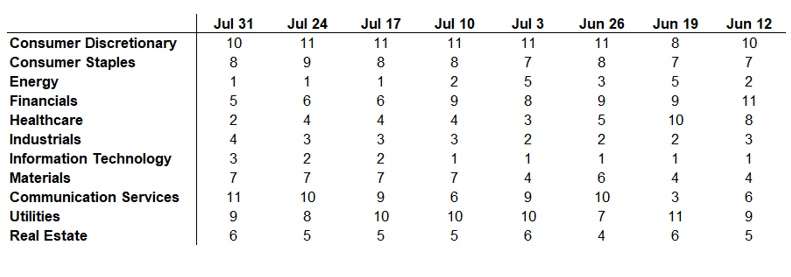
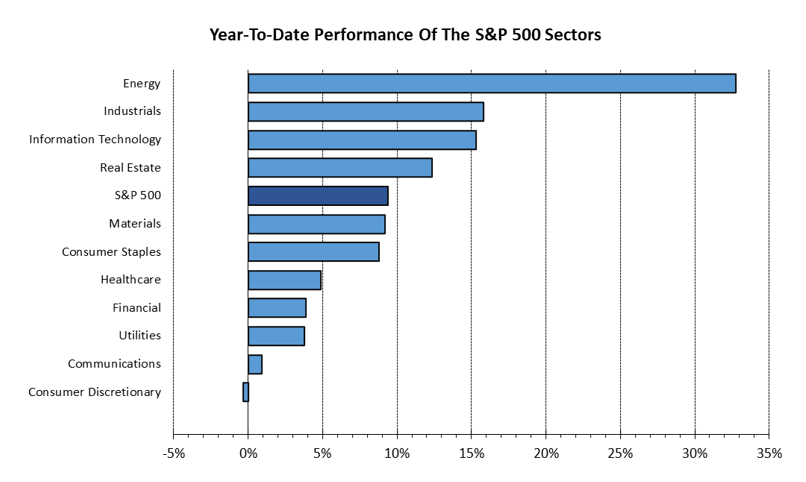
Sector Readings: Energy In First Place, Healthcare Second, Information Technology Third; Communication Services Still In Last Place, Followed By Consumer Discretionary
Energy was strongest last week, followed by Healthcare, then Information Technology. Communication Services was in last place, followed by Consumer Discretionary, then Utilities.
Our sector model analyzes S&P 500 GICS sector classifications, using a weighted measure of price momentum across three time periods. We rank each sector from best to worst based upon the average of its 40-, 26-, and 13-week relative price performances. We rank each sector from 1 to 11, with 1 being the strongest and 11 the weakest.
Sector Rankings By 40-, 26-, And 13-Week Average Relative Price Performance
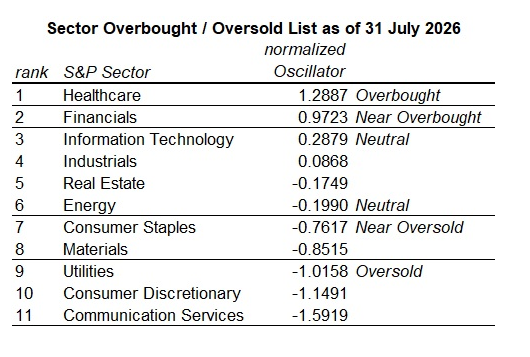
OBOS List: Healthcare Overbought, Financials Near Overbought. Communication Services, Consumer Discretionary, And Utilities Oversold; Materials And Consumer Staples Near Oversold.
Healthcare was overbought again last week, and Financials were near overbought. Communication Services, Consumer Discretionary, and Utilities were oversold. Materials and Consumer Staples were near oversold, as they were last week. The extreme oversold conditions we noted last week have been relieved.
Our tactical sector rotation model uses the S&P 500 GICS sector classifications. We apply a 13-week rate of change methodology that normalizes the rankings from overbought (OB) to oversold (OS). An industry group is overbought when it has risen too far too fast, relative to the rest of the market, based upon its normal movement. Conversely, it’s oversold when it has lost too much too fast, relative to the rest of the market, based upon its normal movement. Over time, a sector tends to move back toward its normal rate of change, relative to the rest of the market. Overbought sectors tend to slow their pace of gains in relative price, while oversold sectors tend to improve in relative price until they reach their average performance again.
Here’s our methodology: the overbought-oversold table of sectors measures the 13-week rate of change in the relative price of each sector. We then average (i.e., smooth) this over 3 weeks and normalize the results. Normalized oscillator values over 1.0 are considered overbought, while those between 0.6 and 1.0 are considered near overbought. Normalized oscillator values below -1.0 are considered oversold, while those between -0.6 and -1.0 are considered near oversold.
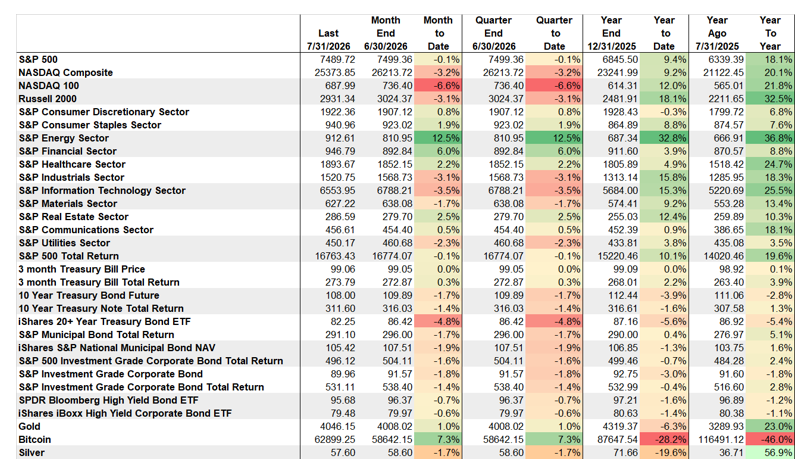
Market Performance: Energy Best Performing Asset, Bitcoin Still Weakest
The Dog Days of Summer Not So Quiet
As we move into the quiet summer period of August, corporate earnings will continue to be announced, warranting careful scrutiny. This week, we get the all-important monthly employment data along with the key economic data on ISM Manufacturing and Services. It will be prudent to keep an eye on interest rate trends, and we’ll be watching to see if either or both the S&P 500 index and the Semiconductor sector can turn their oversold readings into rallies.
The Week's Calendar
MON
9:45 AMUS Manufacturing PMI
10:00 AMISM Report On Business Manufacturing PMI
10:00 AMConstruction Spending
EARNINGSPalantir Technologies*
TUE
8:30 AMTrade
10:00 AMJob Openings & Labor Turnover Survey
10:00 AMFactory Orders
EARNINGSCaterpillar, Advanced Micro Devices, SpaceX
WED
8:15 AMADP National Employment Report
9:45 AMUS Services PMI
10:00 AMISM Report On Business Services PMI
4:05 PMFederal Reserve Governor Lisa Cook speaks at Anchorage Economic Development Corporation
Economic Luncheon
THU
8:30 AMPreliminary Productivity and Costs
8:30 AMWeekly Jobless Claims
10:00 AMMonthly Wholesale Trade
EARNINGSRalph Lauren
FRI
8:30 AMEmployment Report
8:30 AMUnemployment Rate
8:30 AMAvg Hourly Earnings, M/M%
8:30 AMAvg Hourly Earnings, Y/Y%
3:00 PMConsumer Credit
EARNINGSUnder Armour
* Earnings reflect highlights Sources: MarketWatch/Kiplinger's

